The Europe of the 1830s and 1840s was a place of extreme political ferment which led to long-term changes to the way in which all Europeans, including the ones across the English Channel, saw themselves. According to Christopher Clark’s excellent Revolutionary Spring – Fighting for a New World 1848-1849: “parallel political tumults broke out across the entire continent, from Switzerland and Portugal to Wallachia and Moldavia, from Norway, Denmark and Sweden to Palermo and the Ionian Islands. This was the only truly European revolution that there had ever been.”
However you wouldn’t know it from the current Radical Victorians exhibition at the Birmingham Museum and Art Gallery. This explores three generations of progressive British artists working between 1840 and 1910: the Pre-Raphaelite Brotherhood and their circle; the second wave of Pre-Raphaelite artists who gathered around Rossetti from the late 1850s, including William Morris and Birmingham-born Edward Burne-Jones; and a third generation of designers and makers associated with the Arts and Crafts movement, working from the turn of the century to just before the First World War.
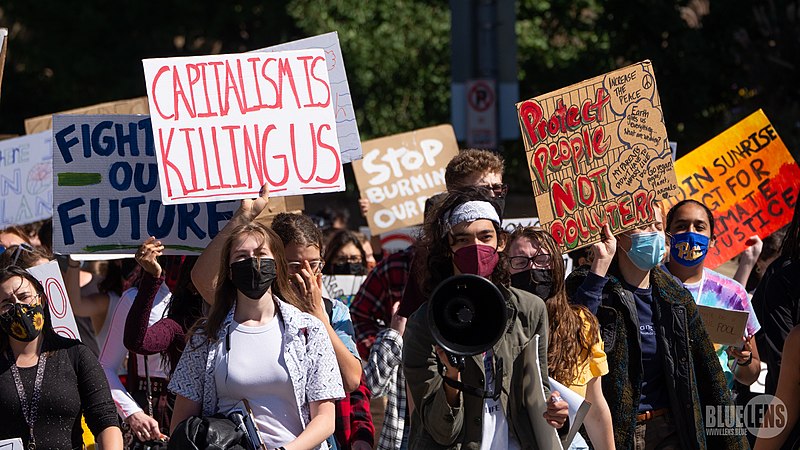
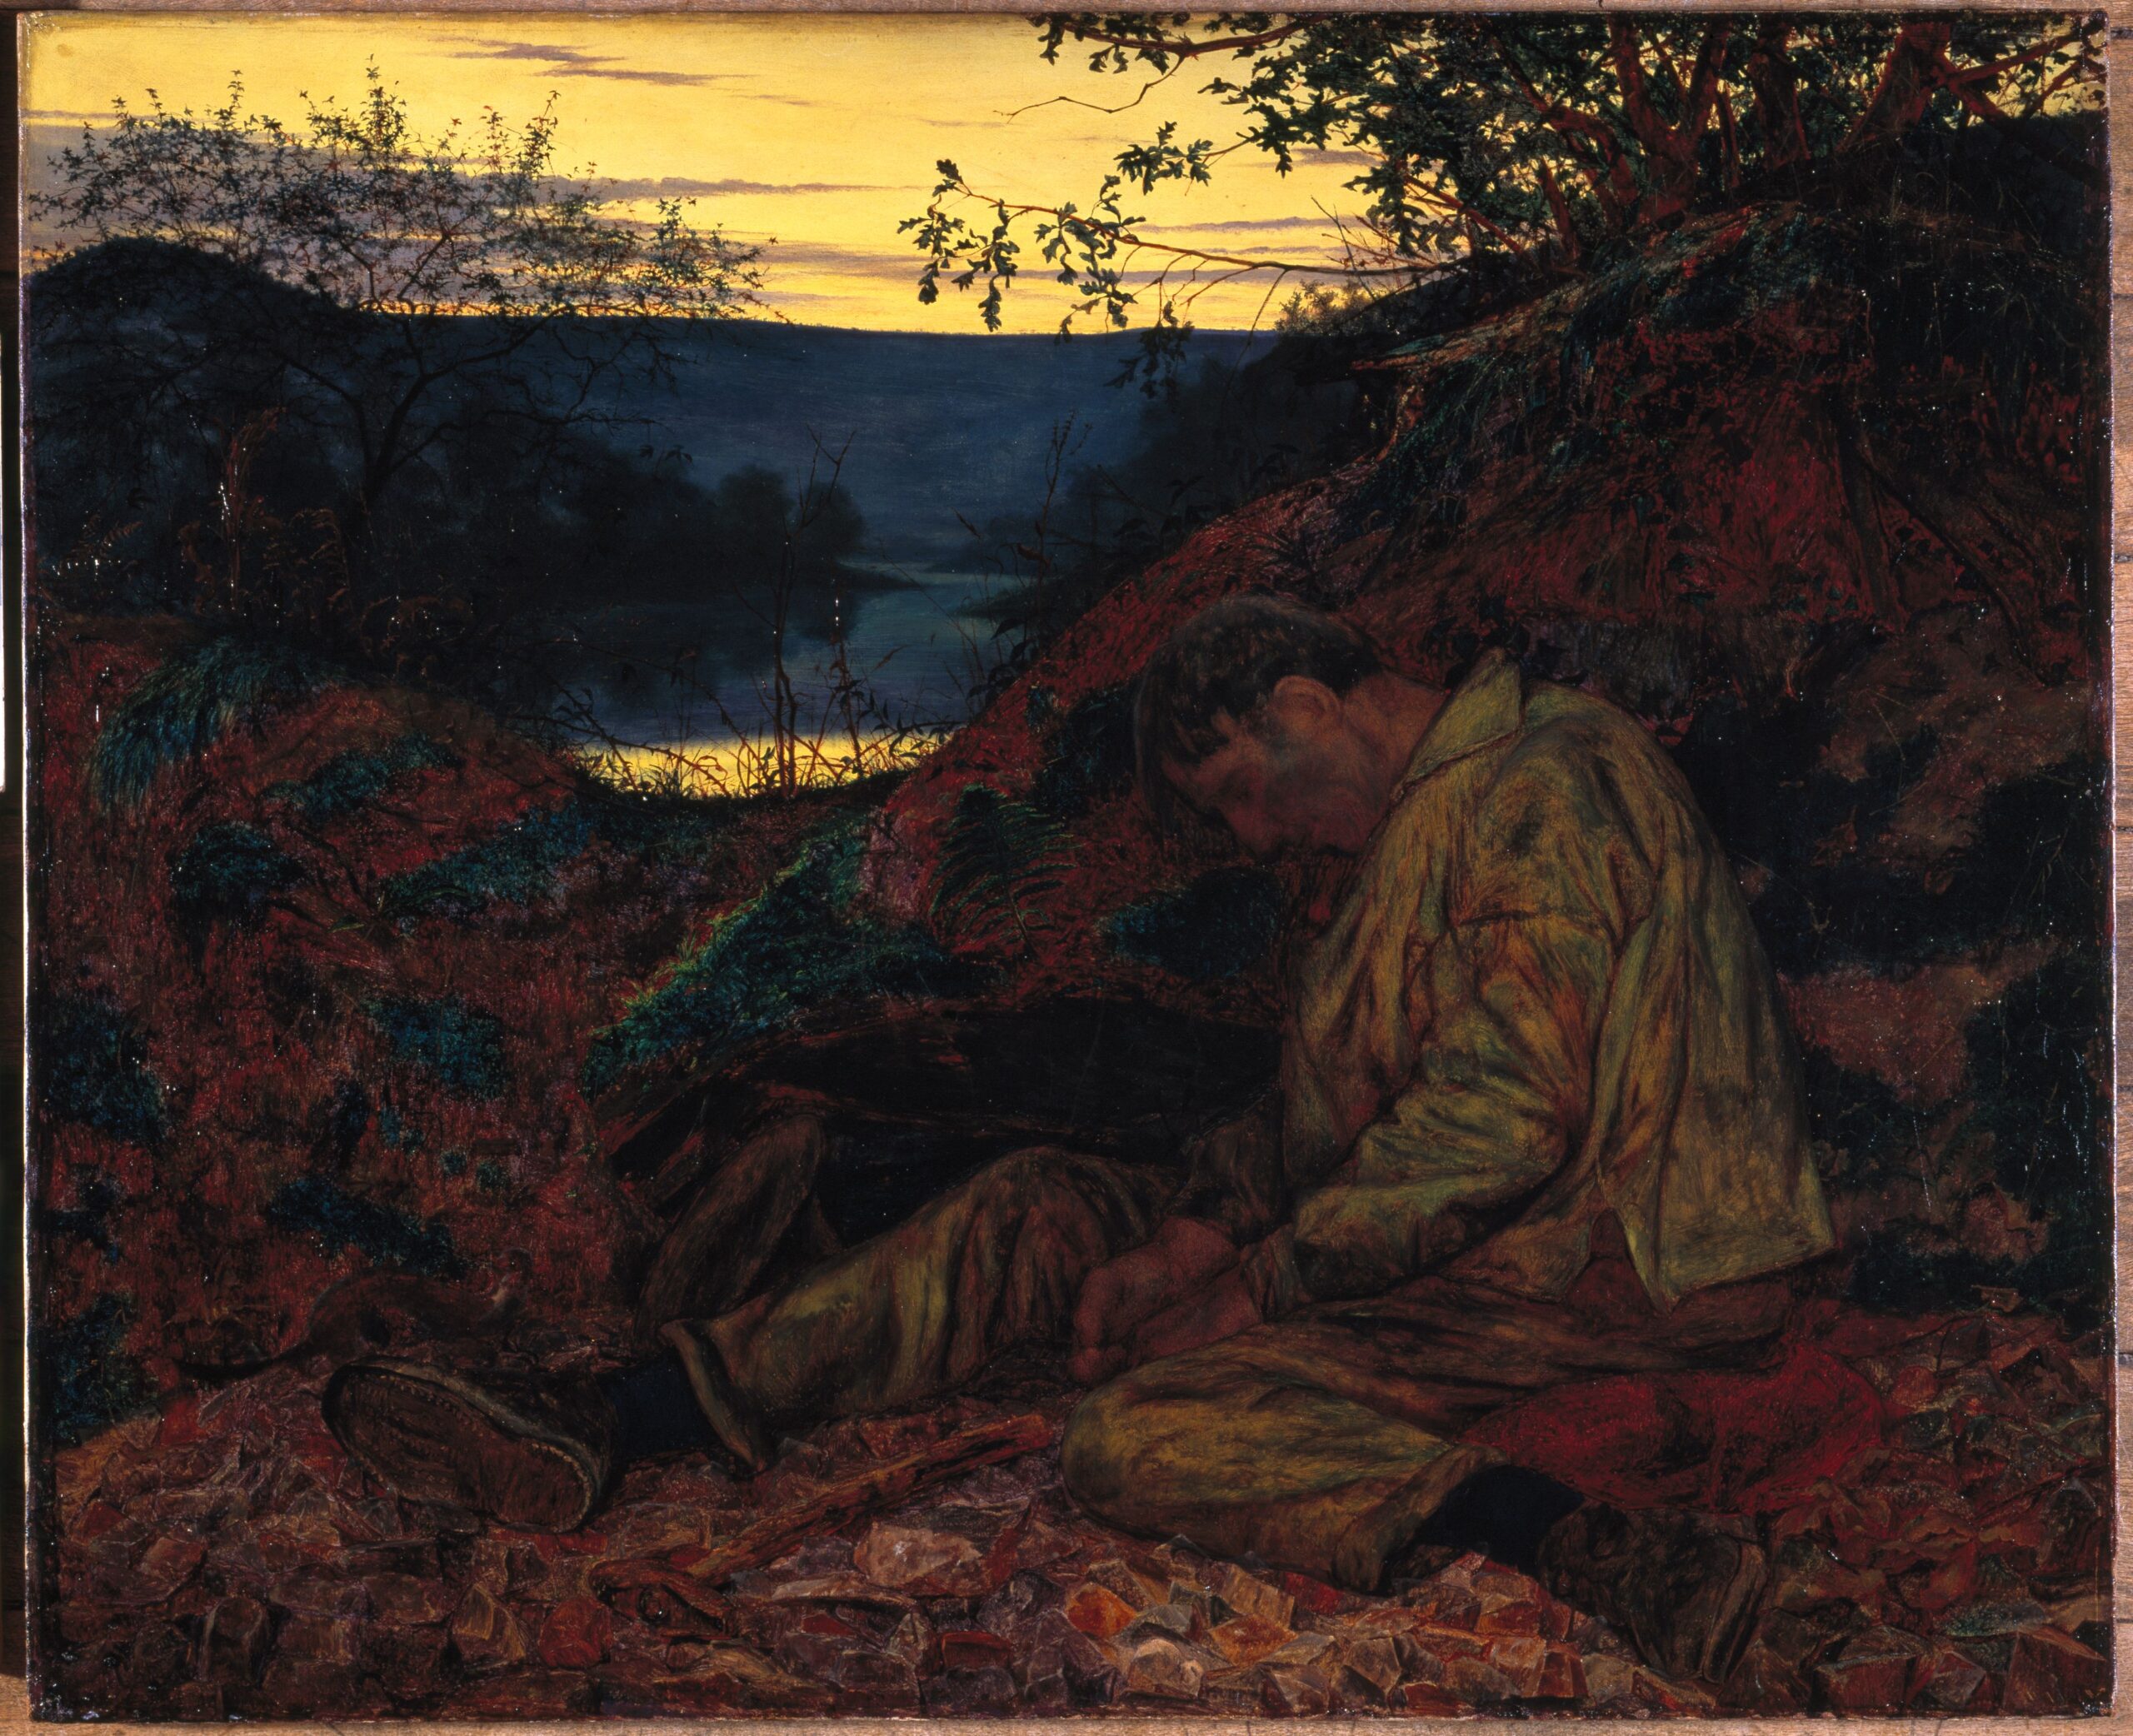
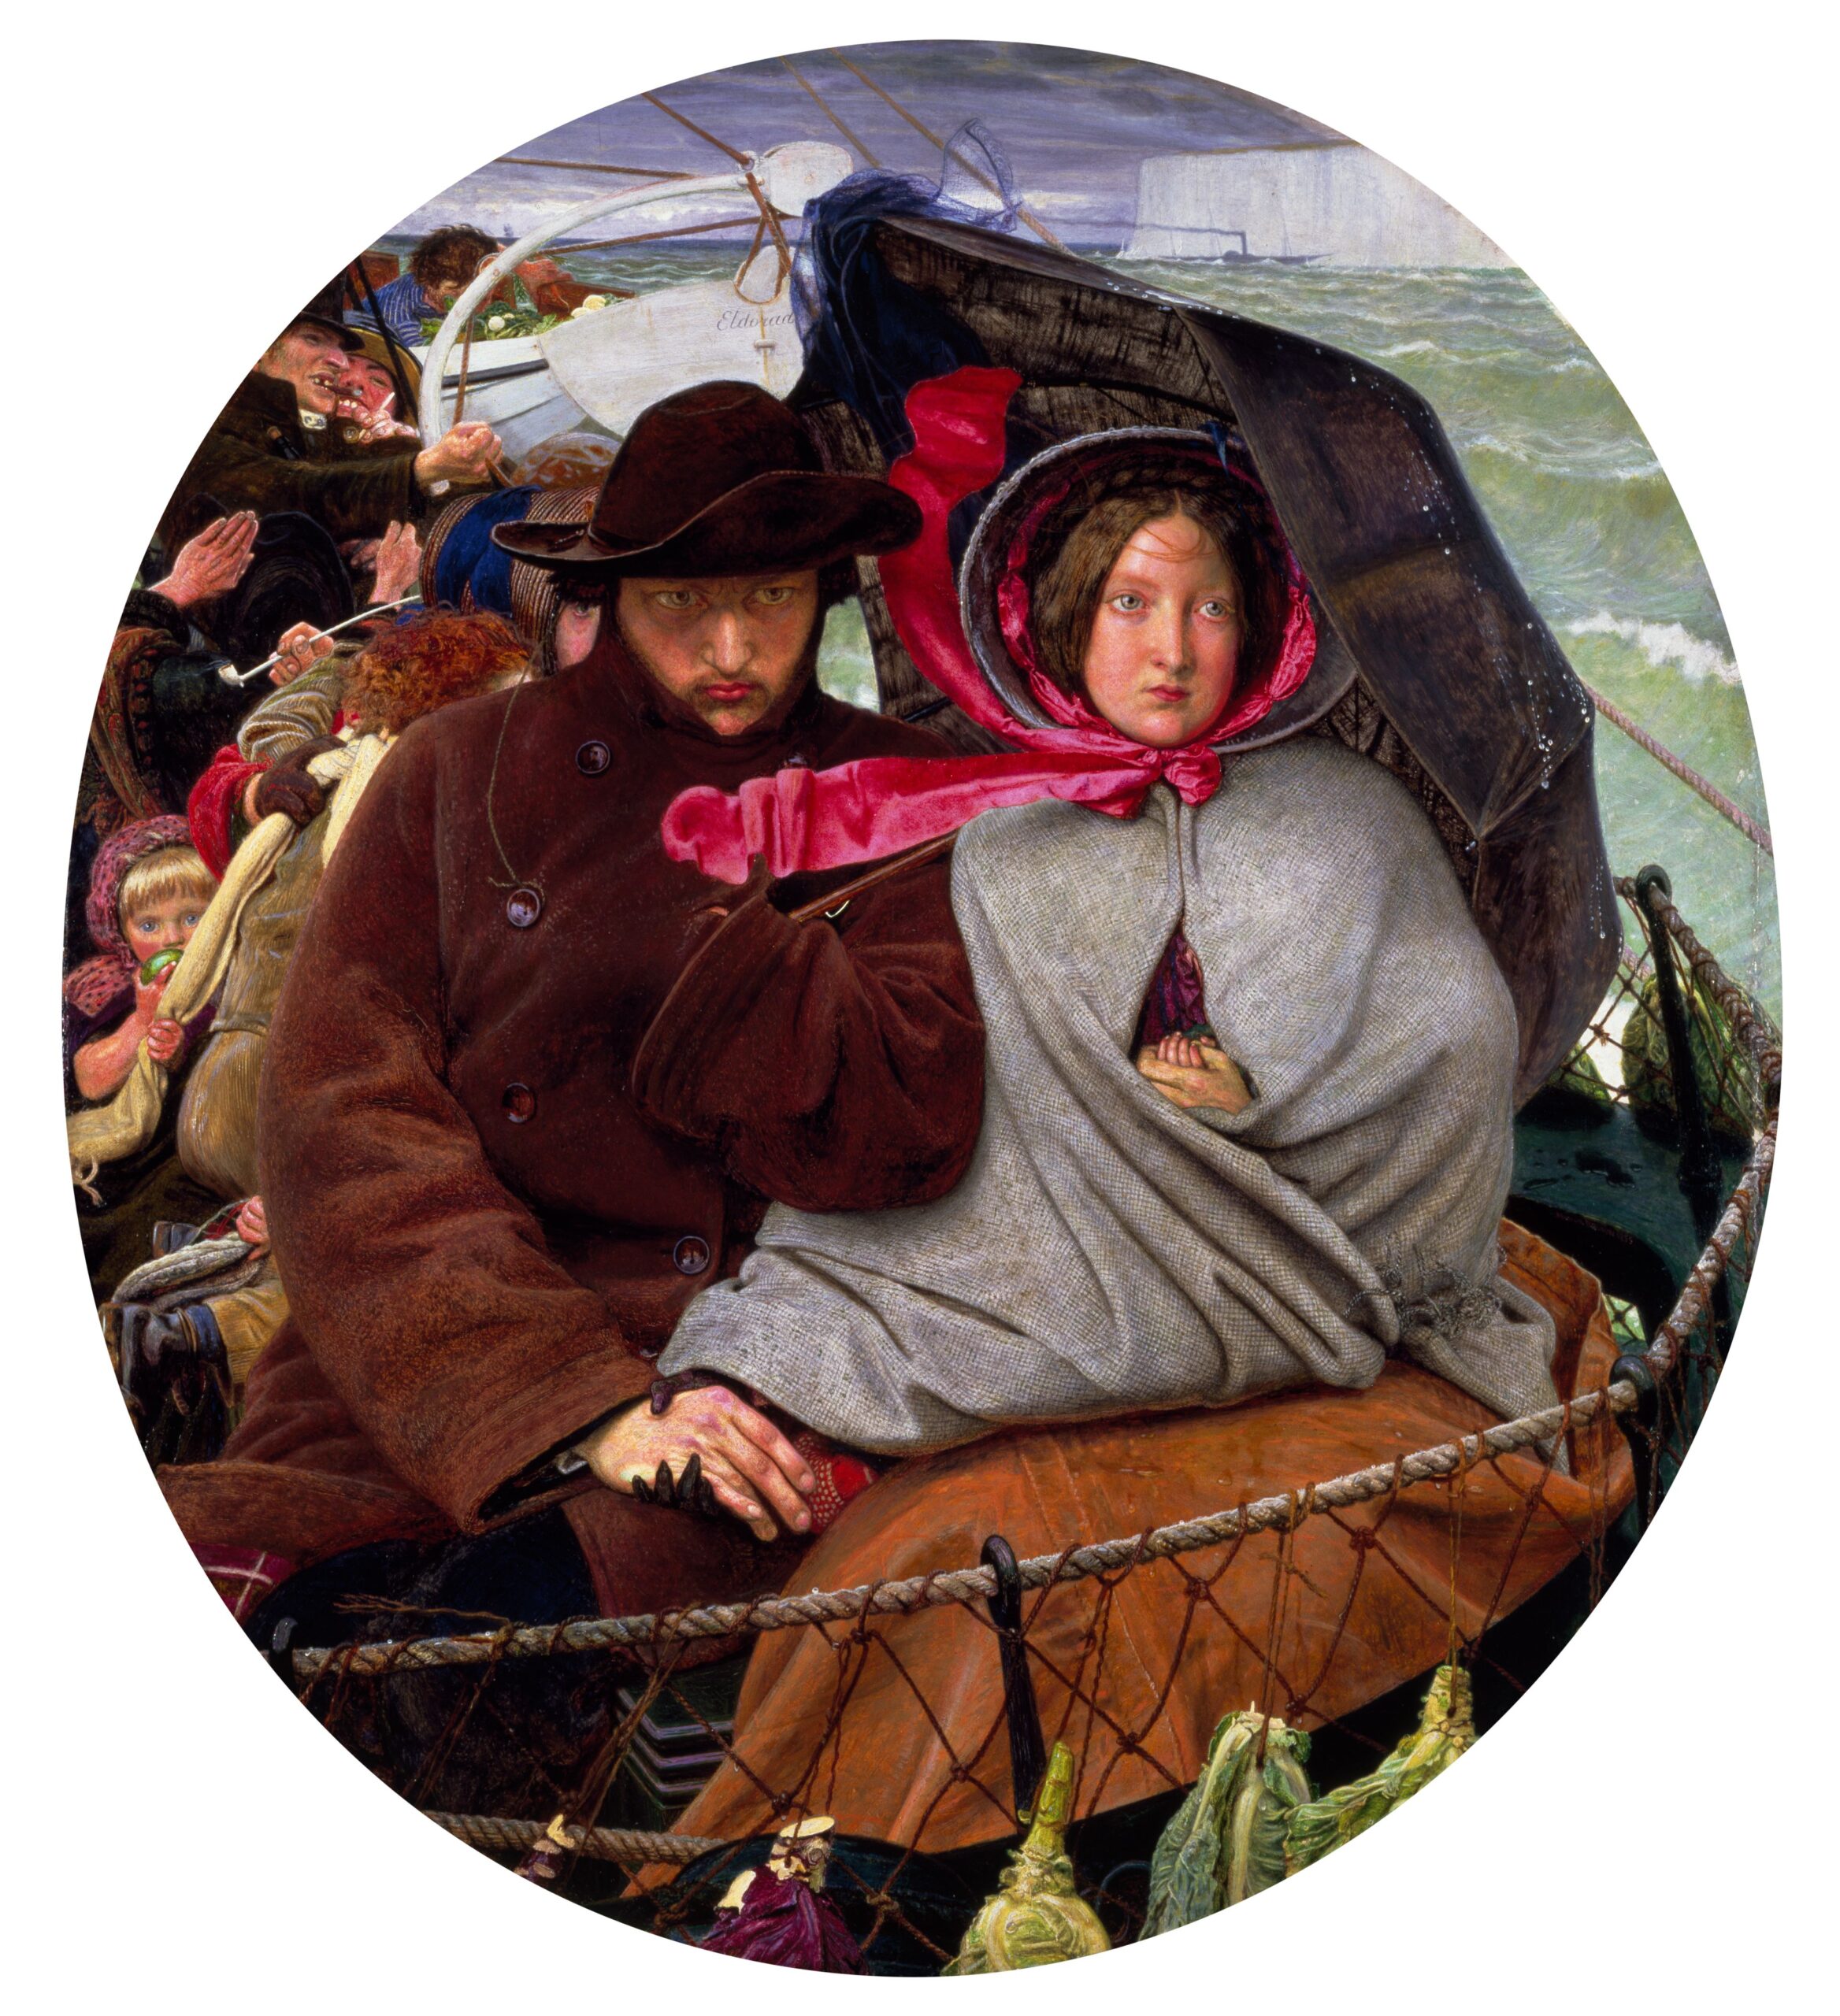
It’s a very good exhibition, but the only painting I could find in it which referred to the economic crises of the 1840s and 50s at all was the one above, of a stone breaker worked to death. There was also the famous one of a couple emigrating to Australia (shown below) which may be a response to domestic economic circumstances although, based on a self portrait of Madox Brown as it is, it may just as well be a response to the lack of art appreciation in the UK:
But that is it! Despite the Victorian Radicals’ believing that art and creativity could change the world and be a real force for good in society, their gaze rarely moved from “realistic” depictions of their friends posing in rustic or suburban landscapes at a time of massive social upheaval.
At the time Britain was rather smug about having avoided revolution, but the evidence suggests that it could have easily been very different were it not for the measures taken by Robert Peel’s Government: the reintroduction of income tax on upper middle class incomes in 1842; the Bank Charter Act of 1844 which suppressed financial speculation by restricting the right to issue bank notes to the Bank of England only and creating a maximum ratio between notes issued and the Bank’s gold reserves; and the repeal of the Corn Laws in 1846 which considerably weakened the landlords’ grain monopoly and allowed for grain imports which did reduce prices but fundamentally changed the structure of the UK economy. This was explosive stuff which brought down Peel’s government and split the Conservative Party.
Policing in the UK was also very muscular. 15,000 Chartist activists were arrested in 1843 and a meeting of 150,000 Chartists at Kennington Common in 1848 was met by 4,000 police, 12,000 troops and 85,000 special constables (volunteers with clubs, including the future Emperor Napoleon III who was in exile from France at the time). There were so many transportations to the colonies that there were mass protests in Australia and the Cape. There were riots in Jamaica and British Guyana when sugar tariffs were dropped to reduce prices back in the UK and when, rather than burdening British taxpayers further, taxes were applied in Ceylon (now Sri Lanka), a protest movement numbering 60,000 was created.
In June 2024, Michael Marmot and Jessica Allen published A programme for greater health equity for the next UK government. In it they say the following:
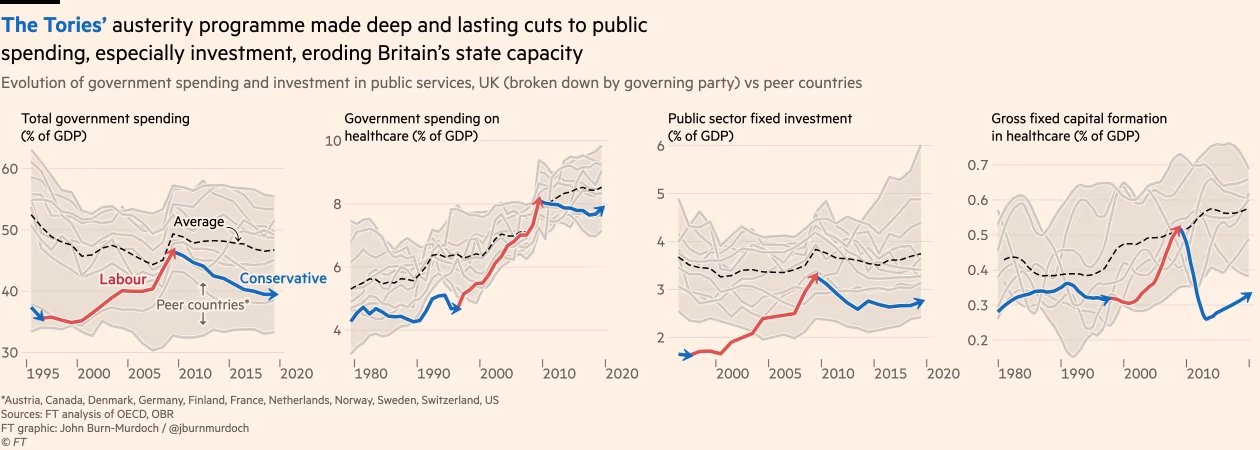
Much of what went wrong with respect to the social determinants of health equity in the period after 2010 comes under the rubric of austerity, imposed by a Conservative Party led coalition Government. In the 2020 Marmot Review, we reported that in 2010 public sector expenditure had been 42% of GDP. Over the next decade, public sector expenditure went down year on year. By the end of the decade, public sector expenditure had become 35% of GDP. An annual reduction of 7% is enormous. In 2023, total UK GDP was £2·687 trillion. 7 7% of that is £188 billion. At today’s prices, annual public sector expenditure in 2019 was £188 billion less than it was in 2010. It is then not a surprise that relative child poverty went up— the steepest rise among 39 OECD countries; 8 absolute measures of destitution increased; welfare payments apart from pensions did not keep pace with inflation; spending on education per pupil went down; the housing shortage became more marked and homelessness and rough sleeping increased; and increases in health-care expenditure fell sharply compared with historic trends. Alongside these major changes, came the slowest improvement in life expectancy in the UK during the decade after 2010, of any rich country except Iceland and the USA.
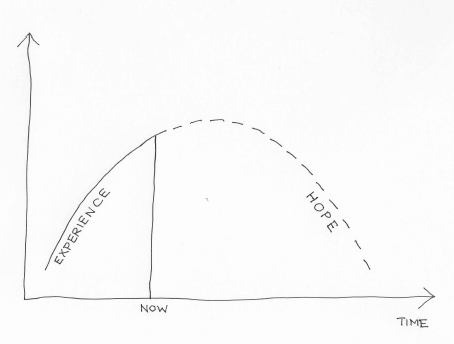
We have a new Government, 100 days in, in our new Carolian era. What will future generations say about who this government answered to? Will it turn out to have been our modern stone breakers, working themselves into sickness and early death below the radar of a modern media at least as divorced from the concerns of ordinary people as the Victorian Radicals were? Or will their hard decisions turn out to necessitate other priorities? Time will tell.