I ask this question because:
- I have just read The Spirit Level by Richard Wilkinson and Kate Pickett, and am convinced by their arguments and evidence that inequality lies at the root of most of the social problems we have in the UK; and
- As a scheme actuary, I persuaded myself that I was facilitating a common good, namely the provision of good pensions to people who might not otherwise have them to as high a level and for as long as possible given the economic conditions of the sponsors. The introduction of the Pension Protection Fund reduced the importance of the scheme actuary role, by mitigating the impact of sponsors not meeting their obligations, but still left a job I felt was worth doing. However, it now seems to me that, if pensions are not tackling inequality or even exacerbating it, they might be doing more harm than good.
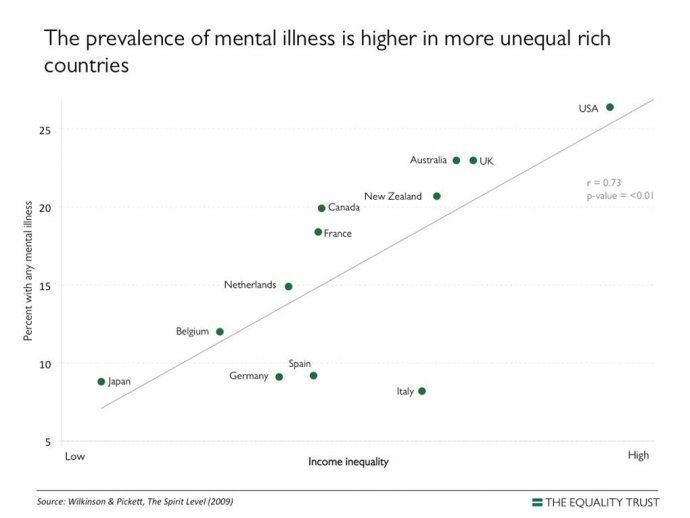
First of all, I strongly recommend the Equality Trust website, which has a number of graphs showing the links between inequality and various social ills. One example, showing the relationship between inequality and mental illness, is set out below.
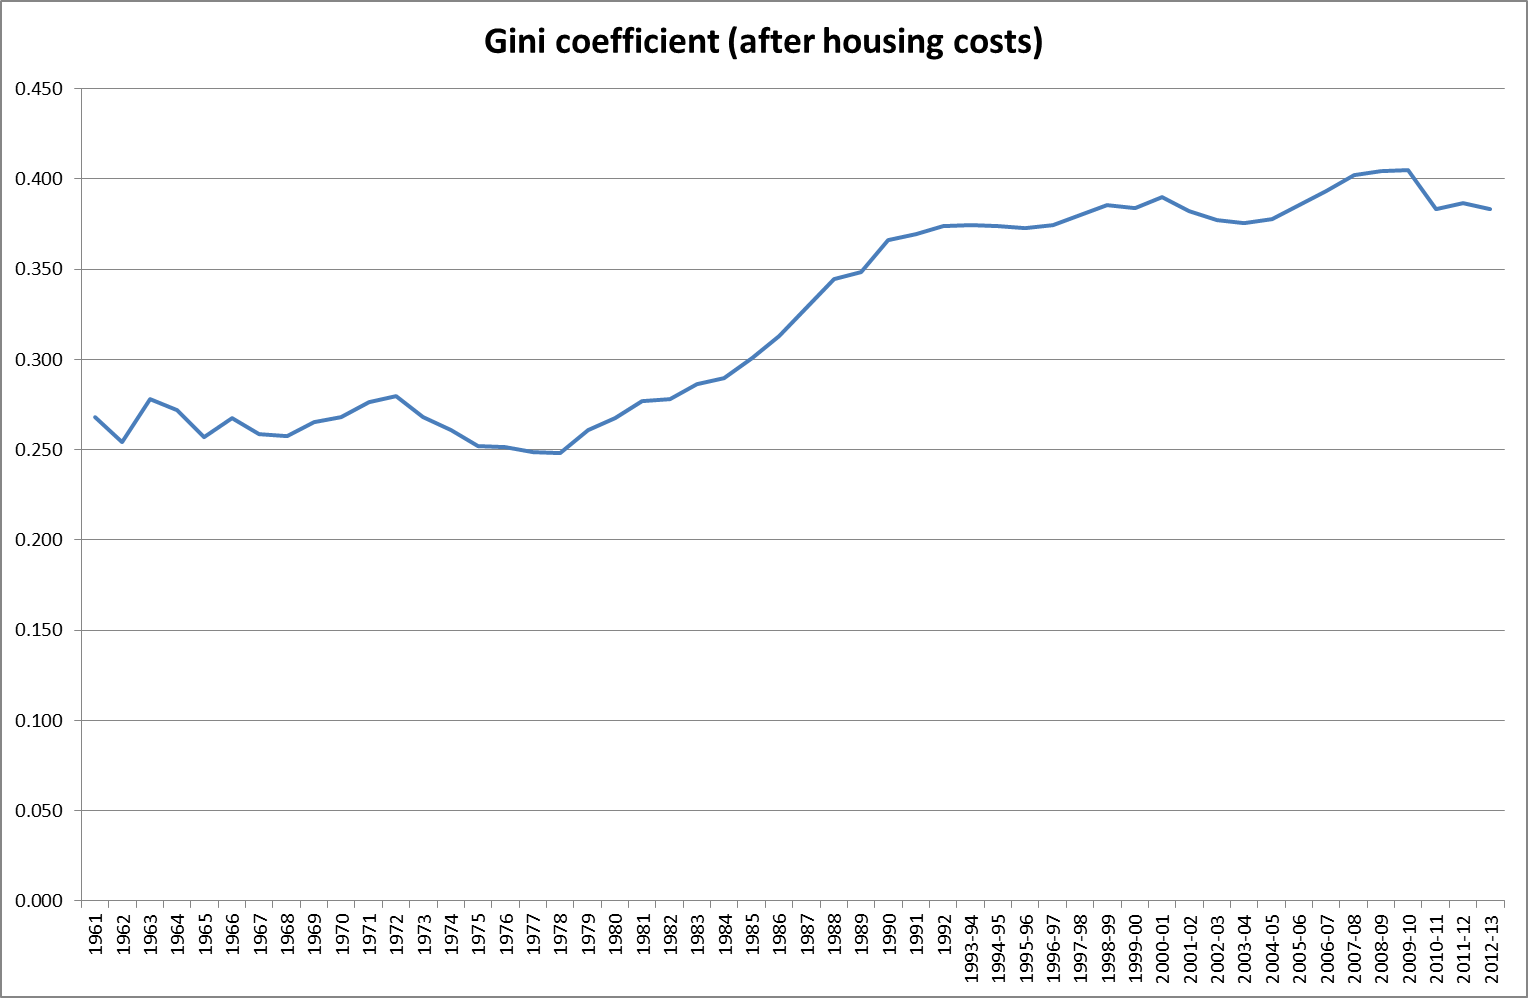
So what is the evidence on inequality and pensions? Certainly inequality, as measured by the Gini coefficient, in this case after a reduction for housing costs, has increased markedly in the UK since the 1960s.
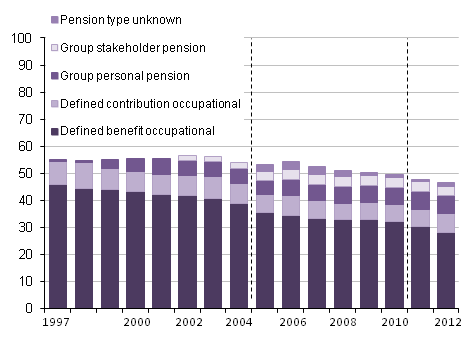
While the proportion of private pension provision since 1997 as a percentage of the workforce has fallen (courtesy of the Office for National Statistics).
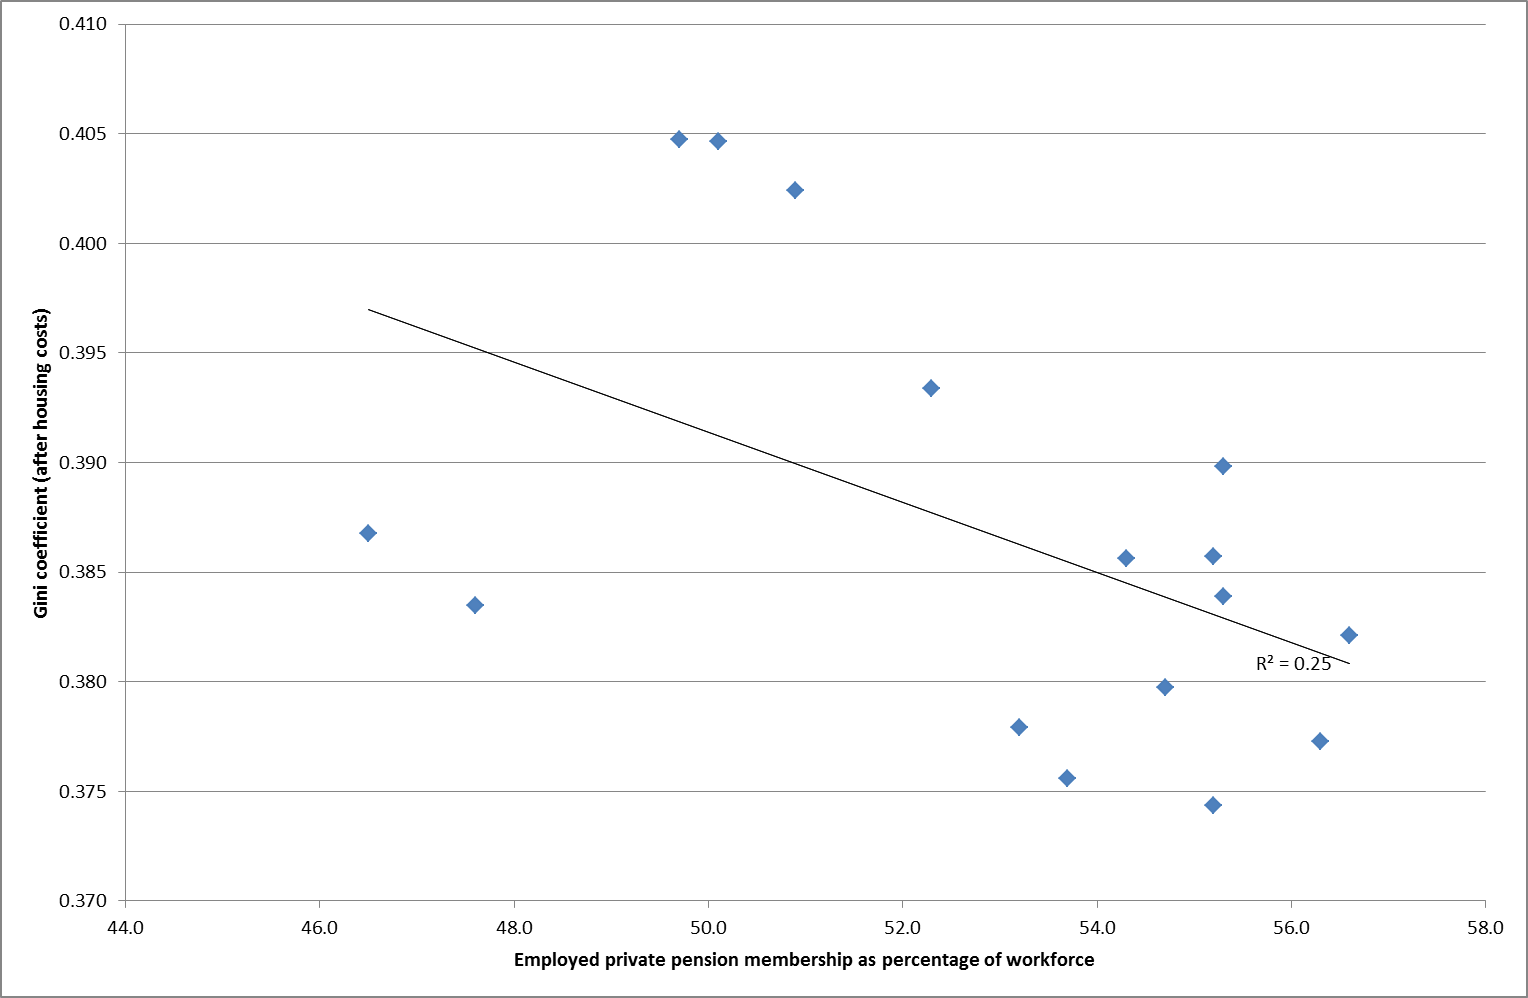
But is there much of a correlation between them? Well there is a weak negative correlation between the Gini coefficient and the percentage in workplace pensions as a whole.
And a rather stronger one when we just look at defined benefit (DB) pension scheme membership.
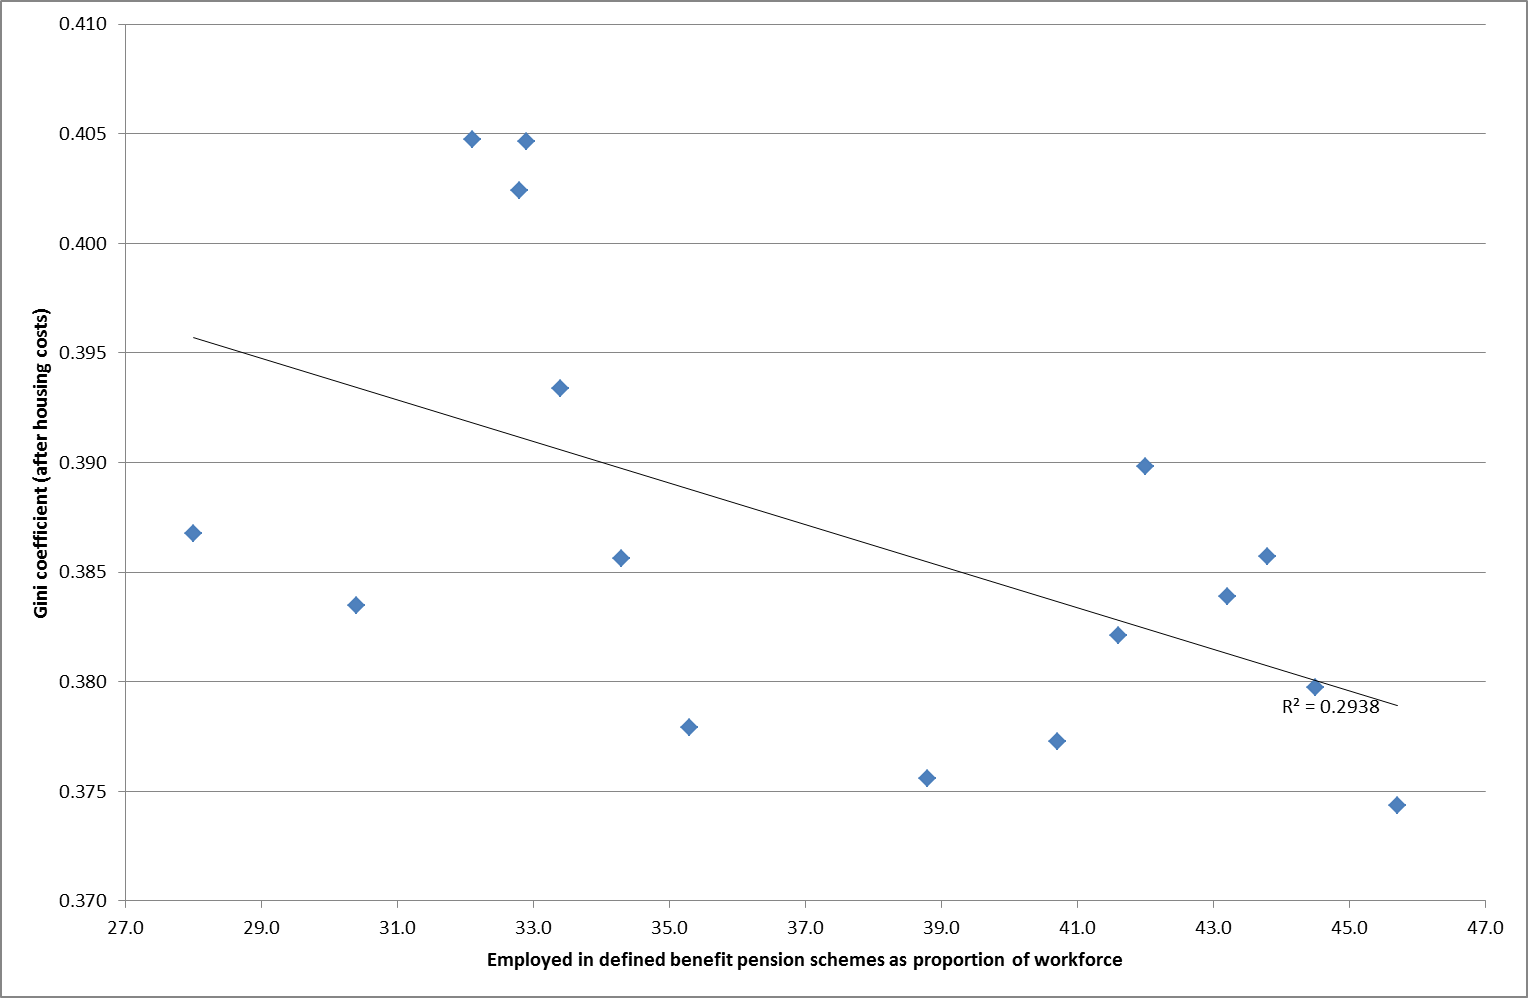
Neither of these are particularly strong correlations. Any impact by workplace pensions on inequality is likely to be limited of course, because they are in general structured (via final salary formulae in the case of DB, and employer and employee contributions as a percentage of salary in the case of defined contribution (DC)) to preserve relative incomes in retirement, even if not absolute differentials. However, moving now to the OECD statistics website, we can look at the retirement age community as a whole and compare their relative inequality with that of the working age population.
Turning to the working age population first, we can see below that the UK is a very unequal society compared to a range of rich countries, although less so than the US.

data extracted on 15 Aug 2014 15:52 UTC (GMT) from OECD.Stat
On the other hand, we get a very different picture if we consider the UK’s over 65 population, where the level of inequality is well below that of the US, and broadly comparable with the other major EU states.
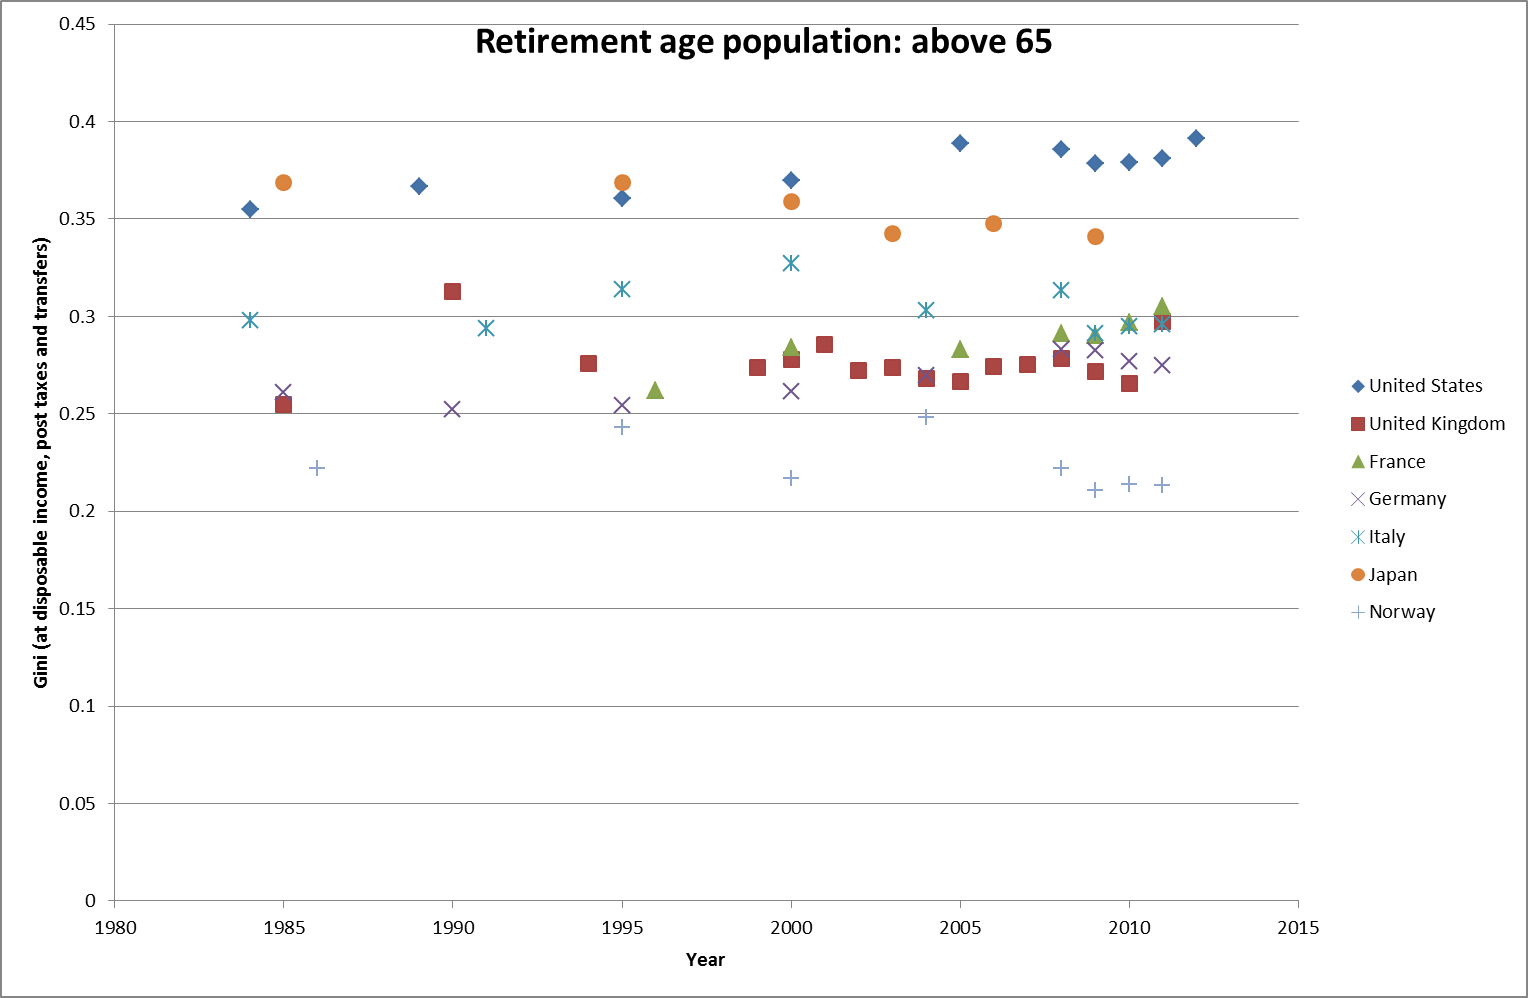
data extracted on 15 Aug 2014 15:52 UTC (GMT) from OECD.Stat
Clearly this is not primarily down to private pension provision, but the more redistributive state pension and other benefits. However, at least the weak correlations we saw previously suggest that private pensions have not made inequality any worse and possibly slightly mitigated against it.
I think we can do better than this: after all we had inequality levels equivalent to current Norwegian levels back in the early 60s (which is why I included them in the international comparisons above). So the news that pensions tax relief is likely to be provided at a 30% rate for all after the election rather than reflecting the current tax bands is not, in my view, the cause for gnashing of teeth as the Telegraph and others believe but actually a good thing. After all, the Pensions Policy Institute have shown that 2/3rds of all tax relief is going to those earning over £45,000 pa.
One of the clear conclusions of the research carried out in The Spirit Level and elsewhere is that reducing inequality in society benefits every group in it, including those who are redistributed away from. Pension provision has its part to play in this.
And 30% tax relief does not seem like too high a price to me.