To be read to the accompaniment of Lindisfarne singing Fog on the Tyne, or possibly Kate Bush singing The Fog.
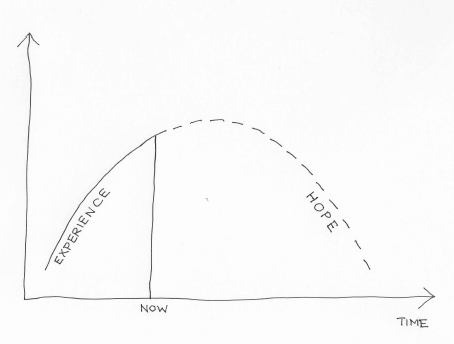
Reporting on AI is all over the place, in both meanings of that phrase. Some think it is very dangerous but that the people working on it should be trusted to police it themselves. Some are retreating from prediction but are instead trying to draw a coastline “knowing the interior is mostly fog”. Some are playing war games in the Arctic with different LLMs. But everyone seems fairly confident they have a hot take. I wonder.
The book I finished this weekend had a passage about a first experiment with a new substance which could shield against gravity. Mr Cavor, the rather unworldly scientist, is explaining to Mr Bedford, a man with no obvious talents other than to look for a quick buck where he can find one, what would have happened if his substance, Cavorite, had not got dislodged fairly quickly from where they had positioned it:
“You perceive,” he said, “it formed a sort of atmospheric fountain, a kind of chimney in the atmosphere. And if the Cavorite itself hadn’t been loose and so got sucked up the chimney, does it occur to you what
would have happened?”
I thought. “I suppose,” I said, “the air would be rushing up and up over that infernal piece of stuff now.”
“Precisely,” he said. “A huge fountain—”
“Spouting into space! Good heavens! Why, it would have squirted all the atmosphere of the earth away! It would have robbed the world of air! It would have been the death of all mankind! That little lump of stuff!”
“Not exactly into space,” said Cavor, “but as bad—practically. It would have whipped the air off the world as one peels a banana, and flung it thousands of miles. It would have dropped back again, of course—but on an asphyxiated world! From our point of view very little better than if it never came back!”
I stared. As yet I was too amazed to realise how all my expectations had been upset. “What do you mean to do now?” I asked.
“In the first place if I may borrow a garden trowel I will remove some of this earth with which I am encased, and then if I may avail myself of your domestic conveniences I will have a bath. This done, we will converse more at leisure. It will be wise, I think”—he laid a muddy hand on my arm—“if nothing were said of this affair beyond ourselves. I know I have caused great damage—probably even dwelling-houses may be ruined here and there upon the country-side. But on the other hand, I cannot possibly pay for the damage I have done, and if the real cause of this is published, it will lead only to heartburning and the obstruction of my work. One cannot foresee everything, you know, and I cannot consent for one moment to add the burden of practical considerations to my theorising…”
The extract is, of course, from HG Wells’ classic The First Men in the Moon, published in 1901.
In case you are in any doubt, Dario Amodei is our Mr Cavor here. I can just imagine his response to the first disaster attributed to AI research being prefaced by “one cannot foresee everything, you know…”. And there are too many Mr Bedfords out there to shake a stick at, trying to sell you anything they can possibly attribute to AI just to keep the whole thing rolling along.
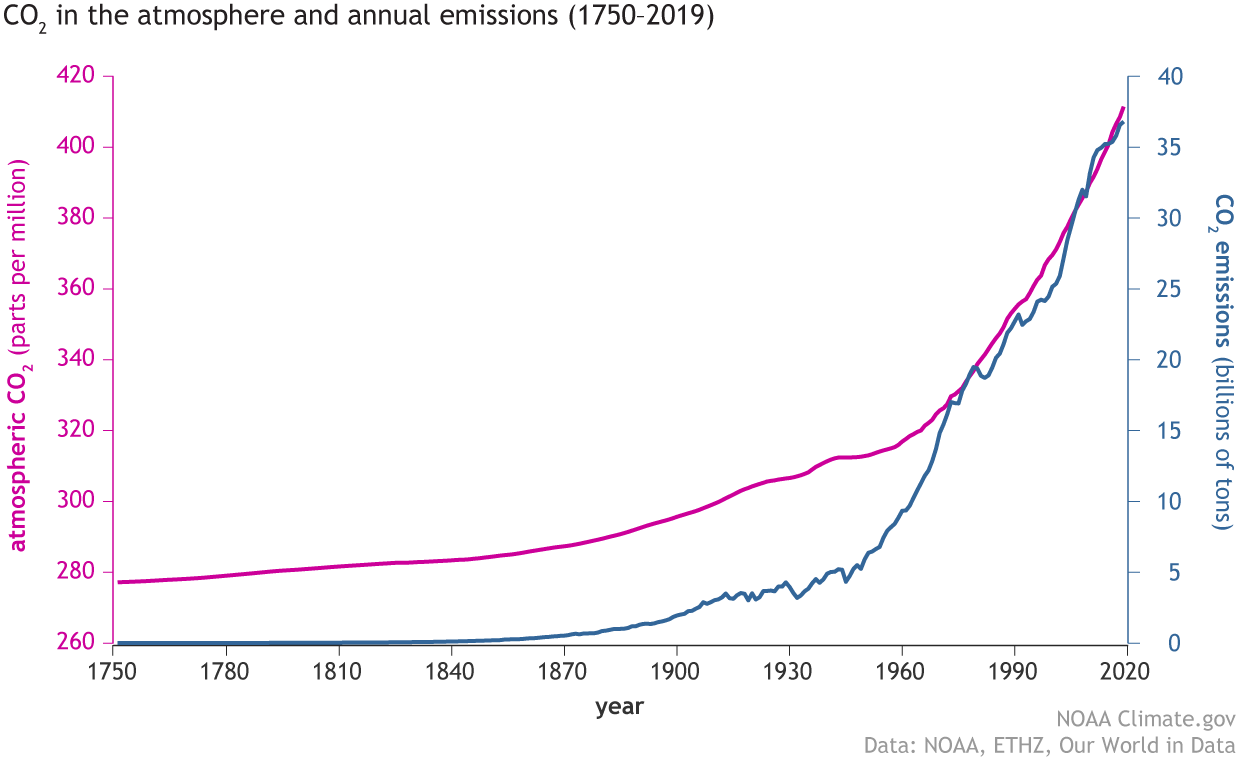
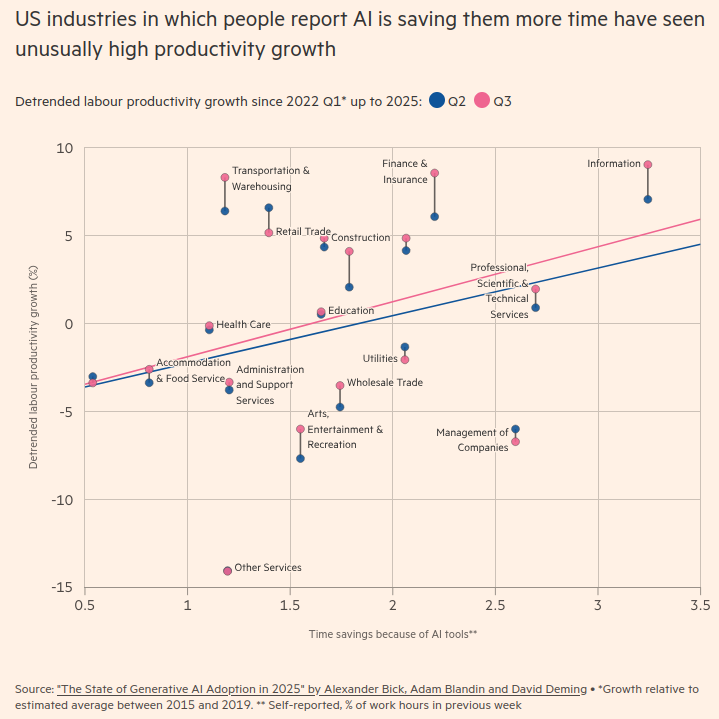
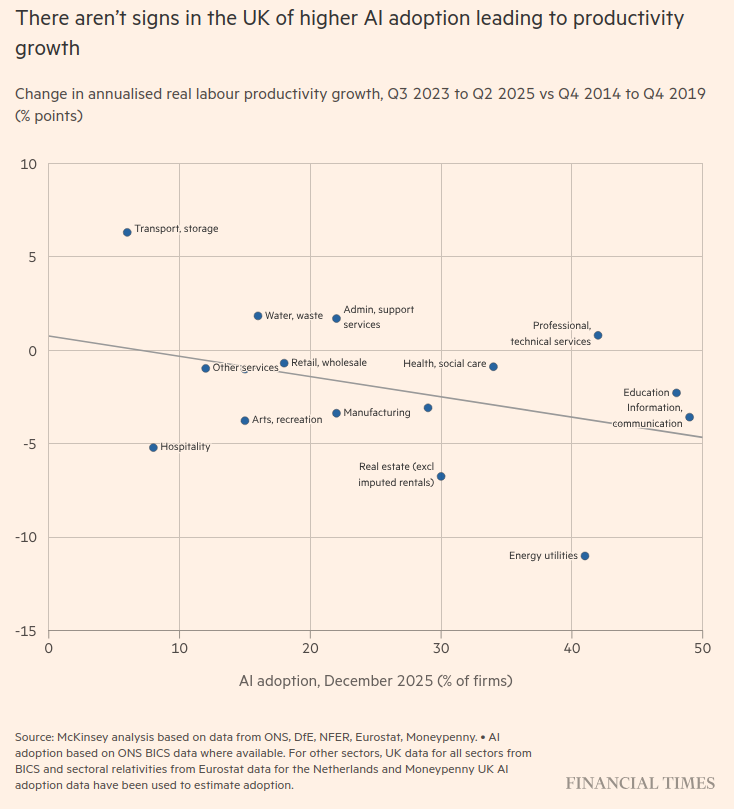
I am with the fog people. The FT seem to be too, with this pair of diagrams attached to this article.
First the US, where there are tentative signs of something they can possibly use as a proxy for productivity growth as a result of using AI:
And this one for the UK, where there aren’t:
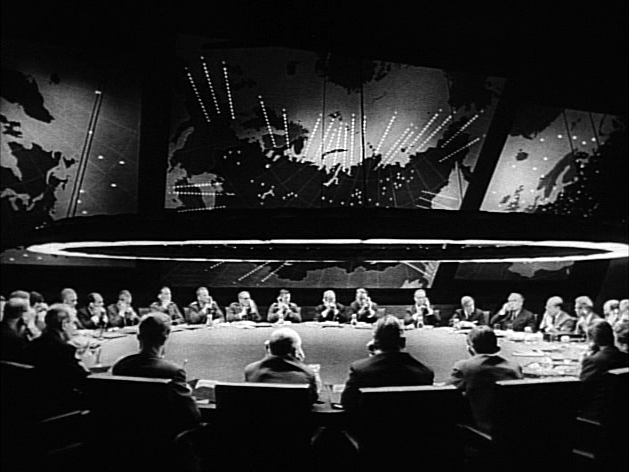
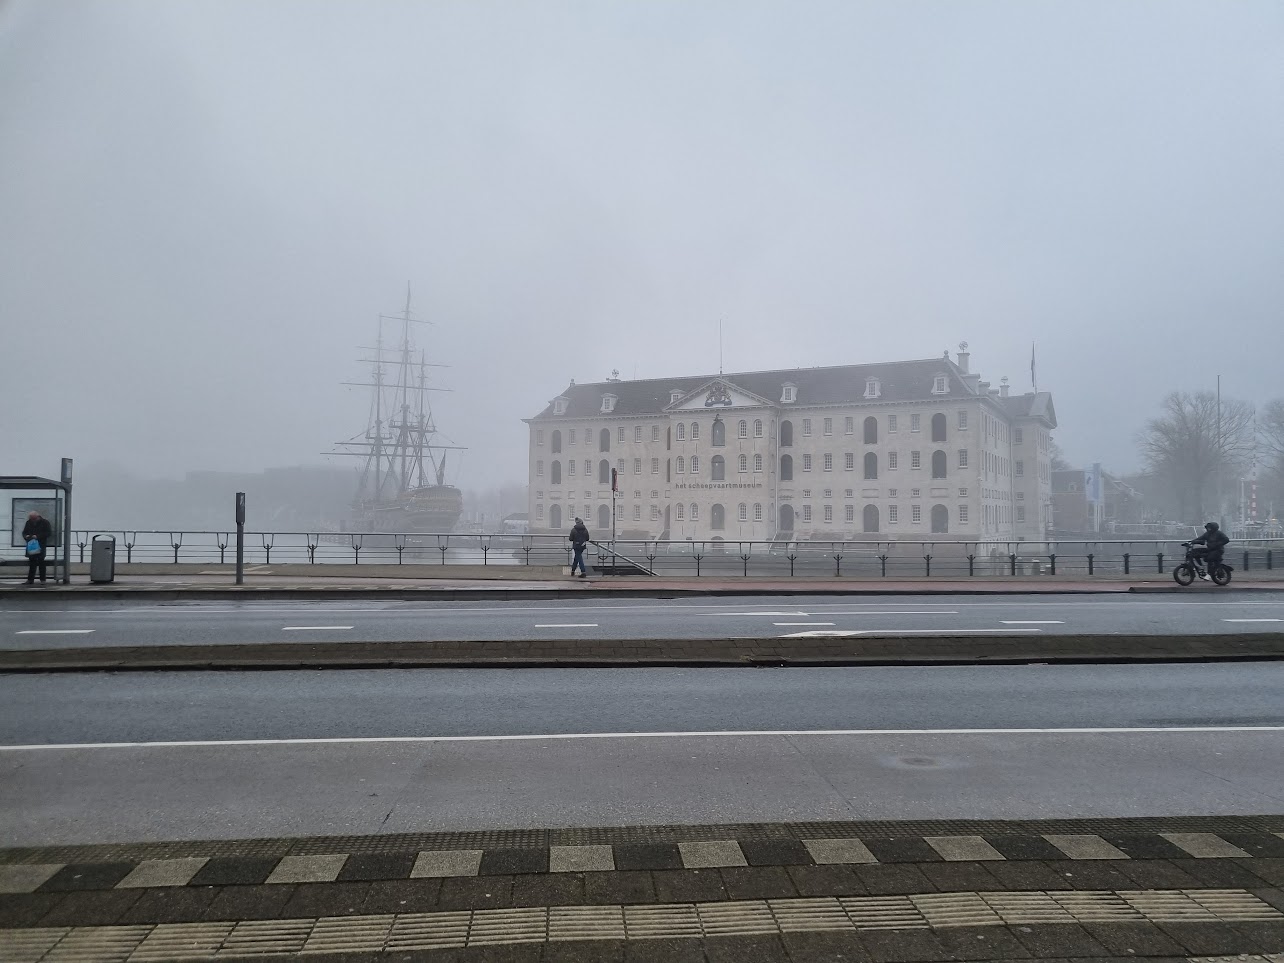
And so it was this foggy sensibility about AI which I took with me to the Bletchley Park Museum last weekend, site of the AI Safety Summit in November 2023 which drew in the US Vice President, Kamala Harris, European Commission President Ursula von der Leyen, Elon Musk, then UK Prime Minister Rishi Sunak, Open AI’s Sam Altman, Meta’s Nick Clegg and Prof Yann LeCun, Meta’s chief AI scientist, amongst around 100 guests invited to suck their teeth about AI.
The thing that particularly struck me at Bletchley Park is that it demystified the emergence of the computer for me. The forerunner, which was the mechanisation using punch cards of the process of sorting the massive amounts of data the centre was receiving in war time, smacks of a group of people who had just run out of wall to spread their webs of cards and strings across. It was a crime investigation which had got out of hand.
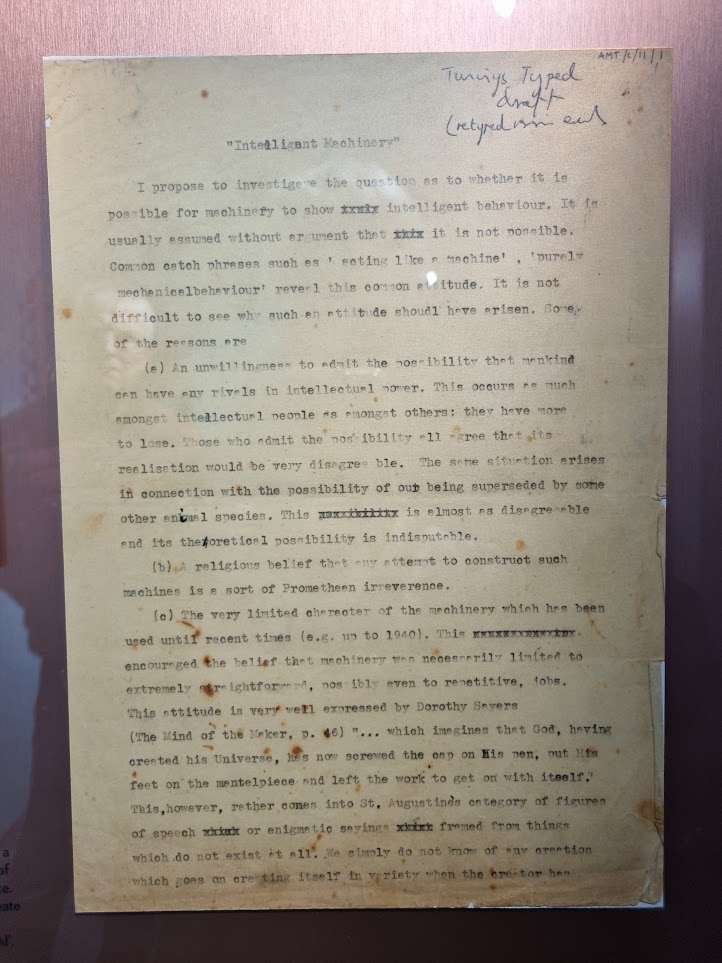
A highlight for me was Alan Turing’s very prescient little note about AI, written in 1940 but anticipating the arguments which would be raging by 2026 (and how poignant that the man who probably did more than anyone to transform what we are able to do by punching a keyboard was chained to one that could only press hunks of metal against a strip of carbon onto a piece of paper):
There is also a hilarious secrecy pledge from the ancestors of the safety summit people, telling you all the ways in which you just need to shut up:
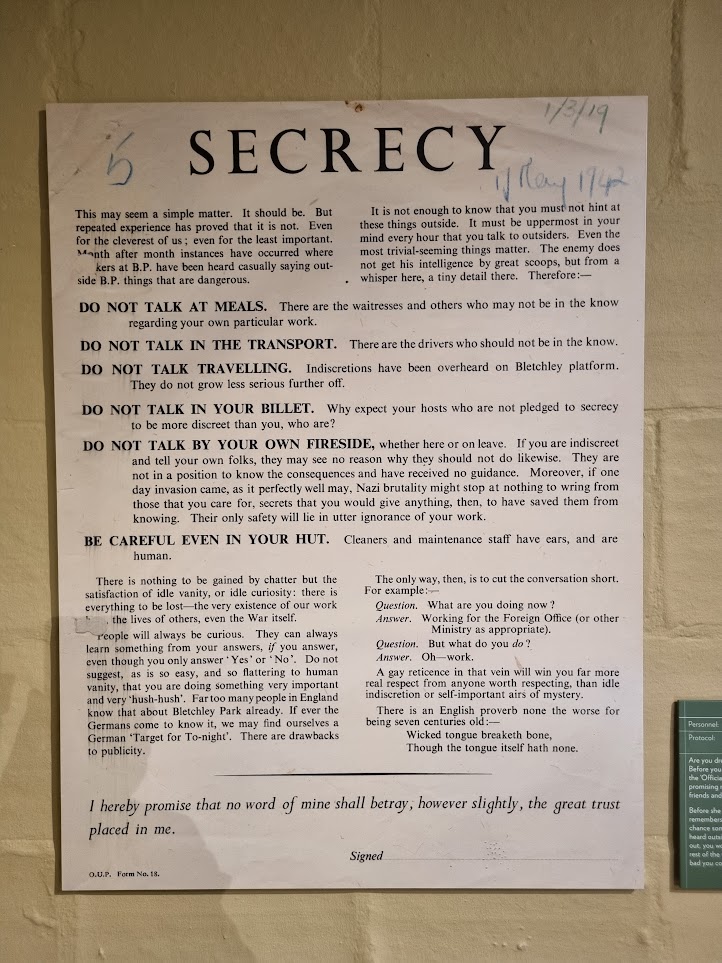
“There is an English proverb none the worse for being seven centuries old:” it thunders.
Wicked tongue breaketh bone,
Though the tongue itself hath none.
Words to live by, I’m sure we’d all agree.
What Bletchley Park was less good at was explaining how the Enigma code was cracked, despite an excellent collection of the hardware involved. For that, I recommend Simon Singh’s The Code Book.
Here was the world’s first “intelligence factory”, scaling up intelligence gathering and analysis as never before and by so doing also changing the way governments would interact with their populations, with just as many implications for our current times as the development of AI. This cluster of huts around a country house rebranded as GCHQ and moved to Cheltenham a few years after World War 2.
Path dependence is a term which describes a situation where past events or decisions constrain later events or decisions. Bletchley Park feels like the Museum of Path Dependence to me.
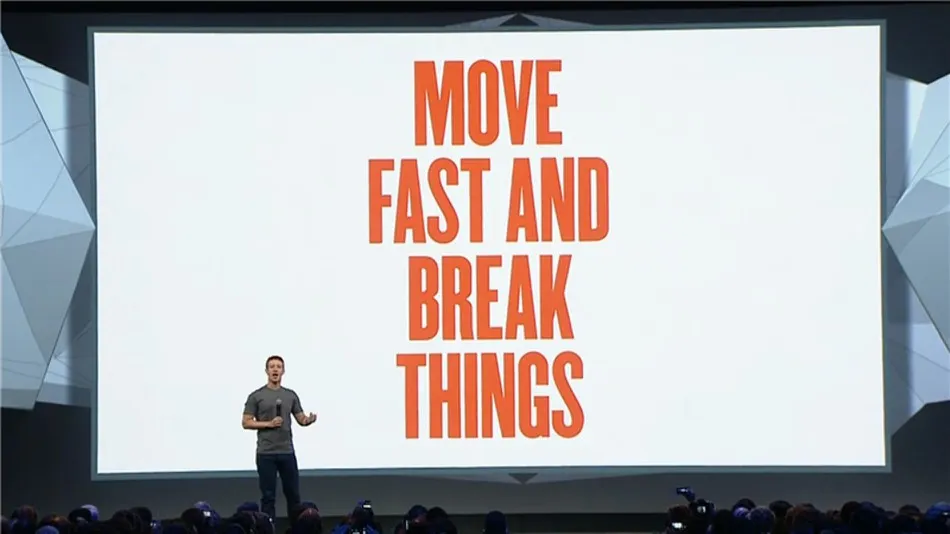
And the legacy of the safety summit? Well my “hot take” would be: when you are a little lost in the fog, it is generally advisable to slow down a bit and take steps to reduce your risk of breaking things. I wonder if I can get that on a bumper sticker.