In the year when I was born, Malvina Reynolds recorded a song called Little Boxes when she was a year younger than I am now. If you haven’t heard it before, you can listen to it here. You might want to listen to it while you read the rest of this.
I remember the first time I felt panic during the pandemic. It was a couple of months in, we had been working very hard: to put our teaching processes online, consulting widely about appropriate remote assessments and getting agreement from the Institute and Faculty of Actuaries (IFoA) for our suggested approach at Leicester, checking in with our students, some of who had become very isolated as a result of lockdowns, and a million other things. I was just sitting at my kitchen table and suddenly I felt tears welling up and I was unable to speak without my voice breaking down. It happened at intervals after that, usually during a quiet moment when I, consciously or unconsciously, had a moment to reflect on the enormity of what was going on. I could never point to anything specific that triggered it, but I do know that it has been a permanent change about me, and that my emotions have been very much closer to the surface ever since. I felt something similar again this morning.
What is going on? Well I haven’t been able to answer that satisfactorily until now, but recently I read an article by David Runciman in the LRB from nine years ago when Donald Trump got elected POTUS the first time. I am not sure that everything in the article has withstood the test of time, but in it Runciman makes the case for Trump being the result of the people wanting “Trump to shake up a system that they also expected to shield them from the recklessness of a man like Trump.”. And this part looks prophetic:
[Trump is]…the bluntest of instruments, indiscriminately shaking the foundations with nothing to offer by way of support. Under these conditions, the likeliest response is for the grown-ups in the room to hunker down, waiting for the storm to pass. While they do, politics atrophies and necessary change is put off by the overriding imperative of avoiding systemic collapse. The understandable desire to keep the tanks off the streets and the cashpoints open gets in the way of tackling the long-term threats we face. Fake disruption followed by institutional paralysis, and all the while the real dangers continue to mount. Ultimately, that is how democracy ends.
And it suddenly hit me that this was something I had indeed taken for granted my whole life until the pandemic came along. The only thing that had ever looked like toppling society itself was the prospect of a nuclear war. Otherwise it seemed that our political system was hard to change and impossible to kill.
And then the pandemic came along and we saw government national and local digging mass graves and then filling them in again and setting aside vast arenas for people to die in before quietly closing them again. Rationing of food and other essentials was left to the supermarkets to administer, as were the massive snaking socially-distanced queues around their car parks. Seemingly arbitrary sets of rules suddenly started appearing at intervals about how and when we were allowed to leave the house and what we were allowed to do when out, and also how many people we could have in our houses and where they were allowed to come from. Most businesses were shut and their employees put on the government’s payroll. We learned which of us were key workers and spent a lot of time worrying about how we could protect the NHS, who we clapped every Thursday. It was hard to maintain the illusion that society still provided solid ground under our feet, particularly if we didn’t have jobs which could be moved online. Whoever you were you had to look down at some point, and I think now that I was having my Wile E. Coyote moment.
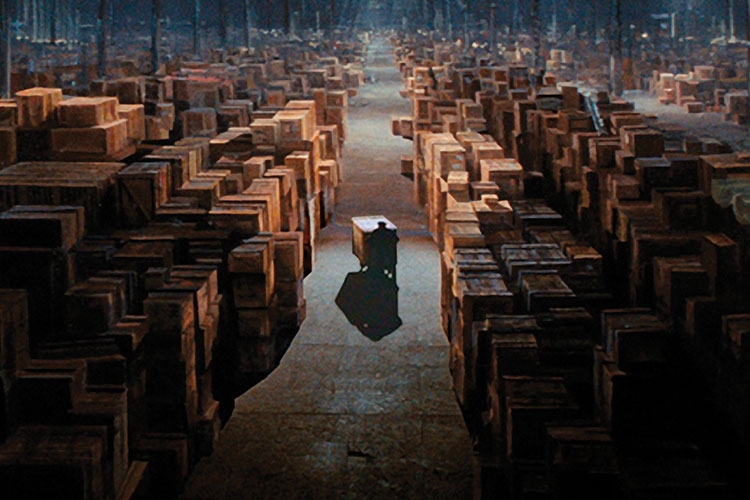
The trouble is, once you have looked down, it is hard to put that back in a box. At least I thought so, although there seems to have been a lot of putting things in boxes going on over the last few years. The UK Covid-19 Inquiry has made itself available online via a YouTube channel, but you might have thought that a Today at the Inquiry slot on terrestrial TV would have been more appropriate, not just covering it when famous people are attending. What we do know is that Patrick Vallance, Chief Scientific Advisor throughout the pandemic, has said that another pandemic is “absolutely inevitable” and that “we are not ready yet” for such an eventuality. Instead we have been busily shutting that particular box.
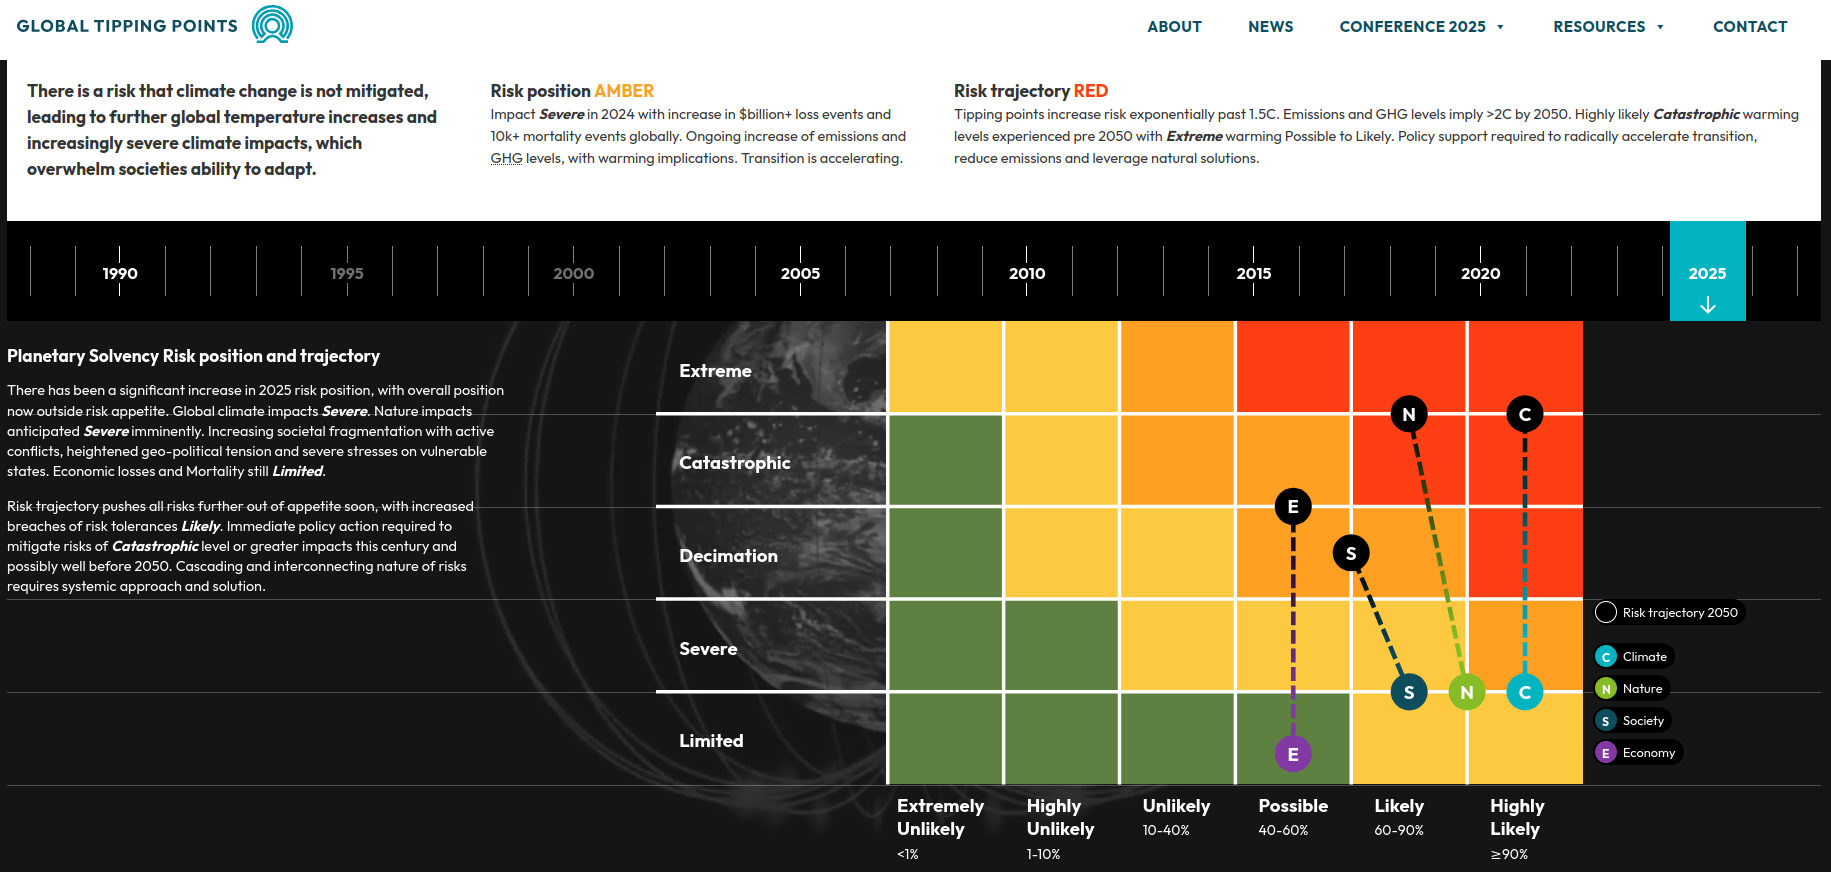
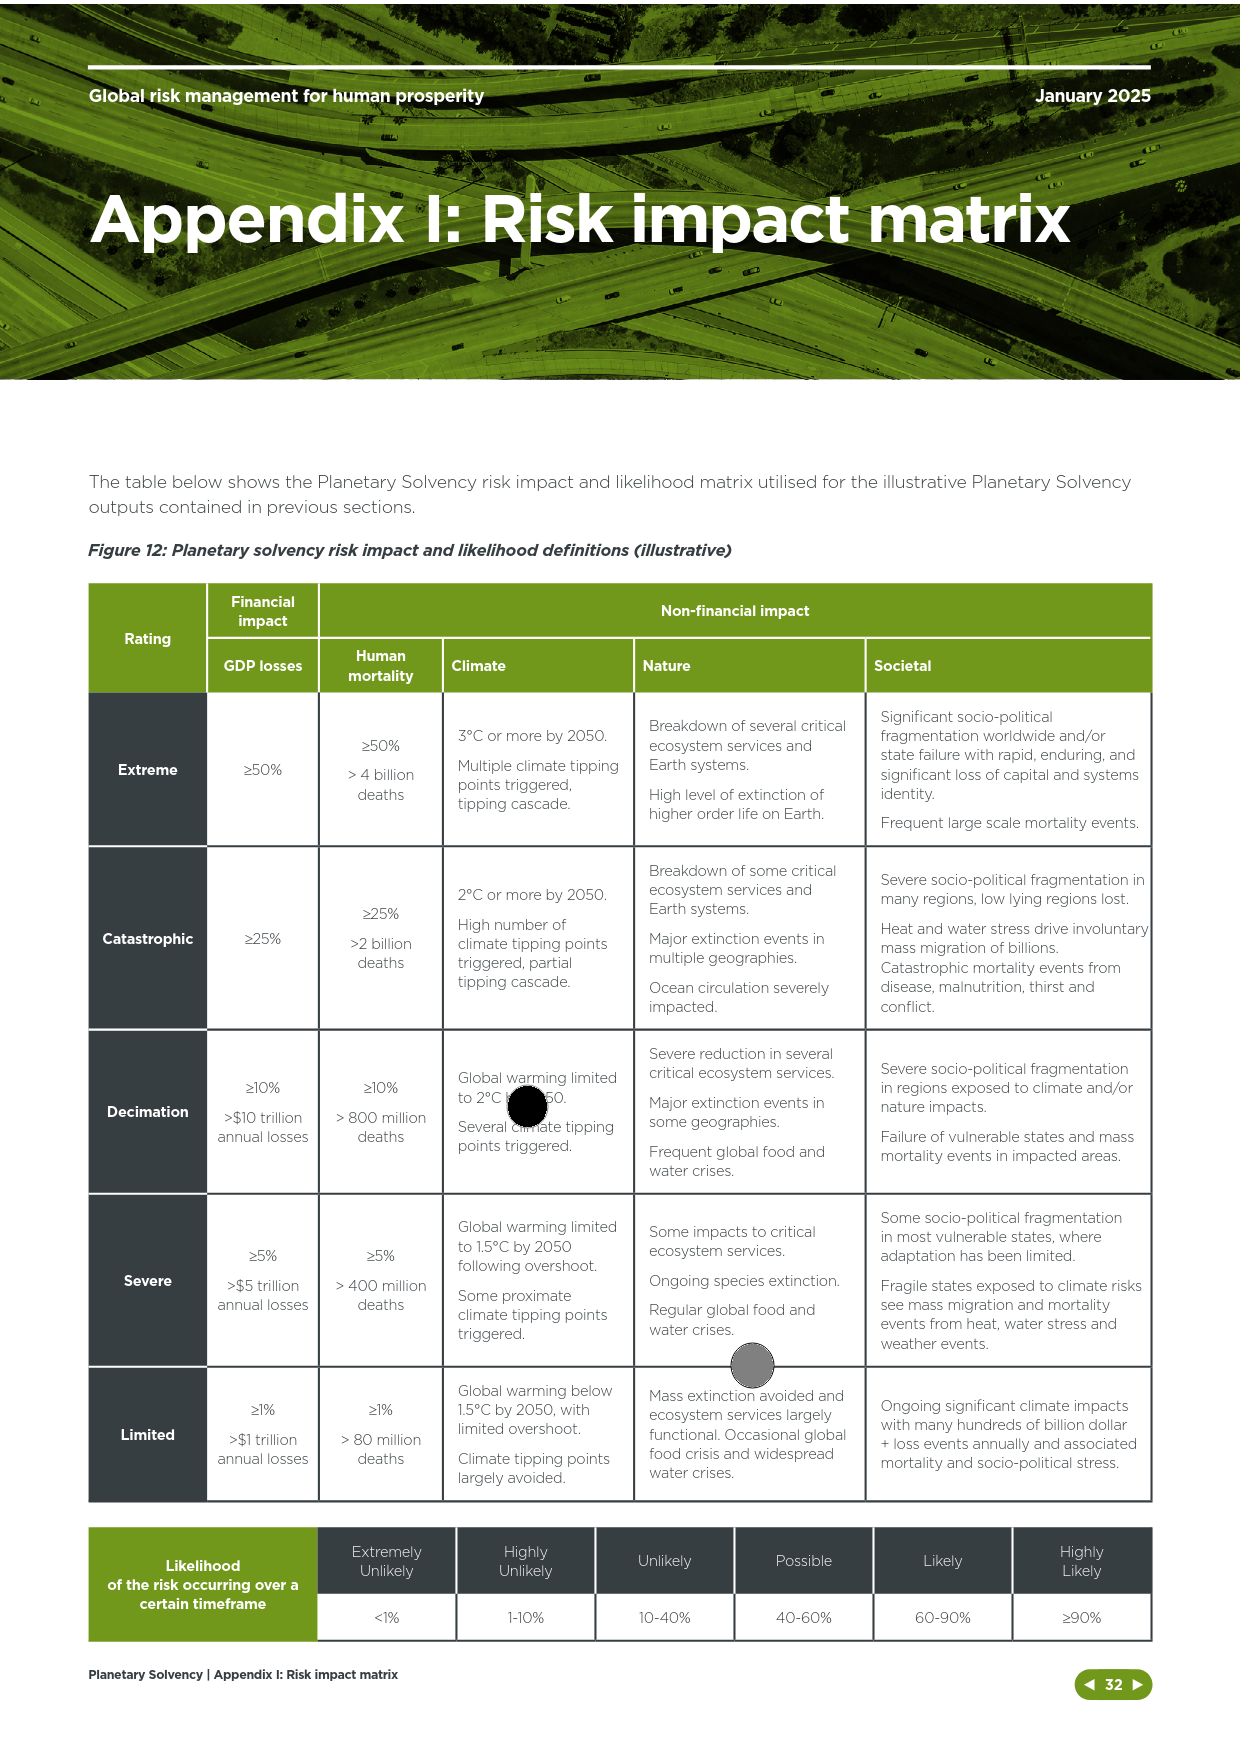
The biggest box of course is climate change. We have created a really big box for that called the IPCC. As the climate conferences migrate to ever more unapologetic petro-states, protestors are criminalised and imprisoned and emissions continue to rise, the box for this is doing a lot of work.
And then there are all the NHS boxes. As Roy Lilley notes:
If inquiries worked, we’d have the safest healthcare system in the world. Instead, we have a system addicted to investigating itself and forgetting the answers.
But perhaps the days of the box are numbered. The box Keir Starmer constructed to contain the anger about grooming gangs which the previous 7 year long box had been unable to completely envelop also now appears to be on the edge of collapse. And the Prime Minister himself was the one expressing outrage when a perfectly normal British box, versions of which had been giving authority to policing decisions since at least the Local Government (Review of Decisions) Act 2015 (although the original push to develop such systems stemmed from the Hillsborough and Heysel disasters in 1989 and 1985 respectively) suddenly didn’t make the decision he was obviously expecting. That box now appears to be heading for recycling if Reform UK come to power, which is, of course, rather difficult to do in Birmingham at the moment.
But what is the alternative to the boxes? At the moment it does not look like it involves confronting our problems any more directly. As Runciman reflected on the second Trump inauguration:
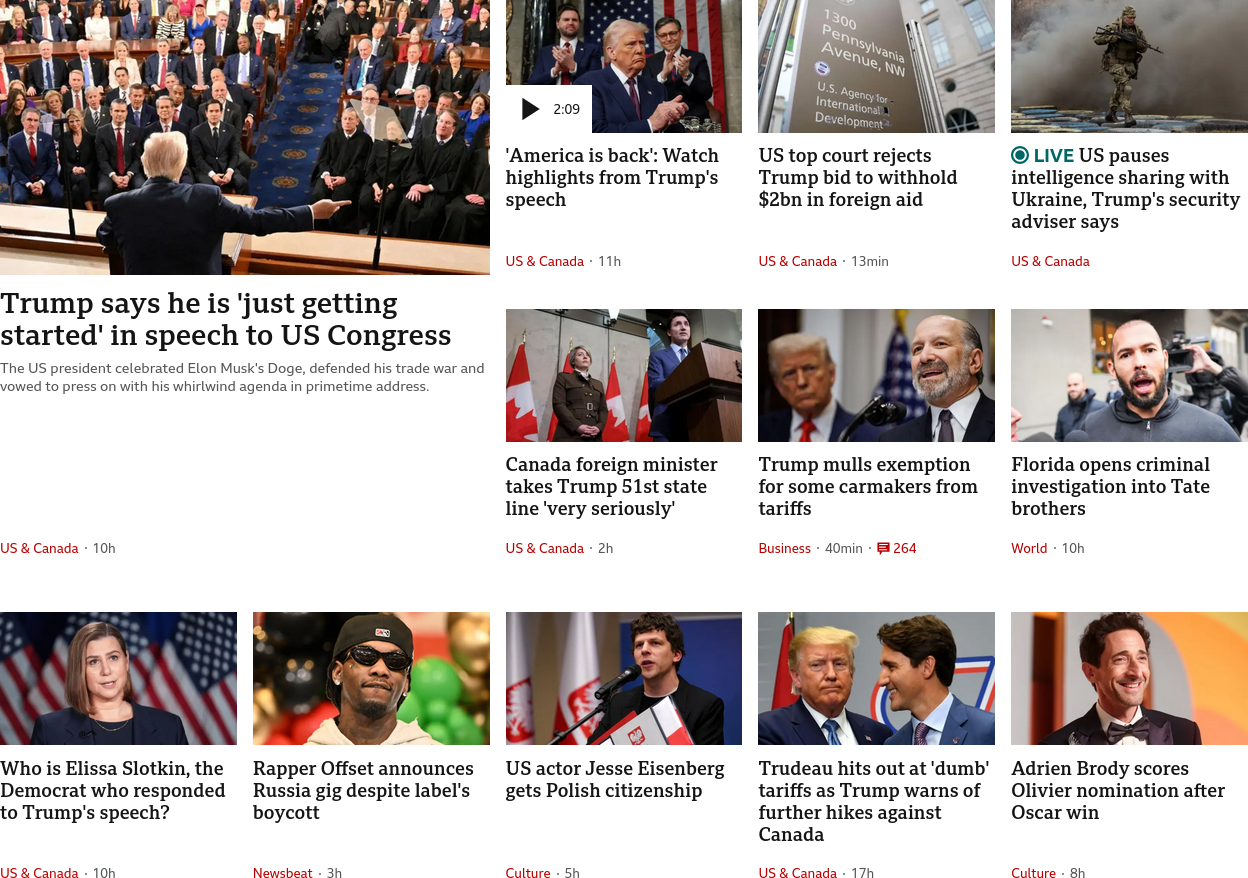
Poor Obama had to sit there on Monday and witness the mistaking of absolutism for principle and spectacle for politics. I don’t think Trump mistakes them – he doesn’t care enough to mind what passes for what. But the people in the audience who got up and applauded throughout his speech – as Biden and Harris and the Clintons and the Bushes remained glumly in their seats – have mistaken them. They think they will reap the rewards of what follows. But they will also pay the price.
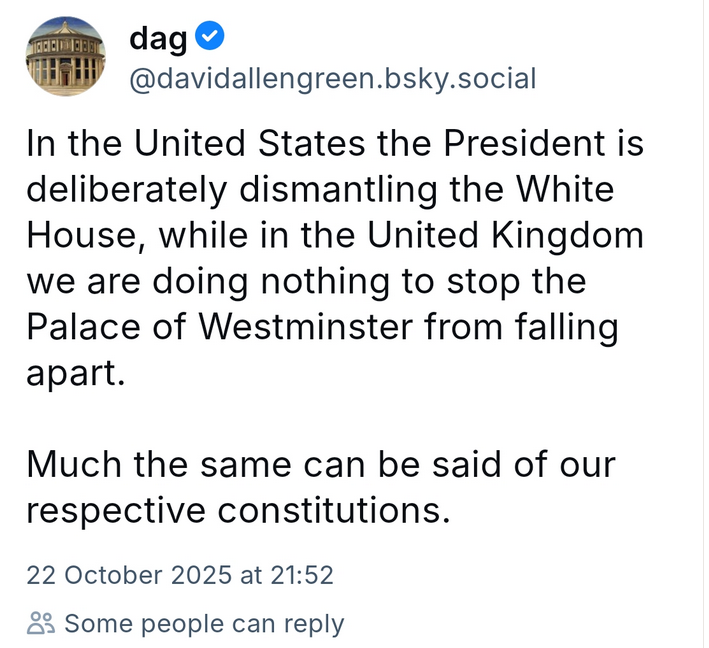
David Allen Green’s recent post on BlueSky appears to summarise our position relative to that of the United States very well: