
I previously wrote a blog in 2013 based around the Office for National Statistics (ONS) statistical bulletin entitled Estimates of the Very Old (including Centenarians), 2002-2011, England and Wales, which summarises how the proportions living to 90 years old and above have changed since 1981. It showed us a population living within a population: Nonagenarian (ie the over 90s) England and Wales (NEW) within the full population of England and Wales. I thought it might be time for an update, based on the latest ONS bulletin from September 2020, which now covers the period 2002-2019.
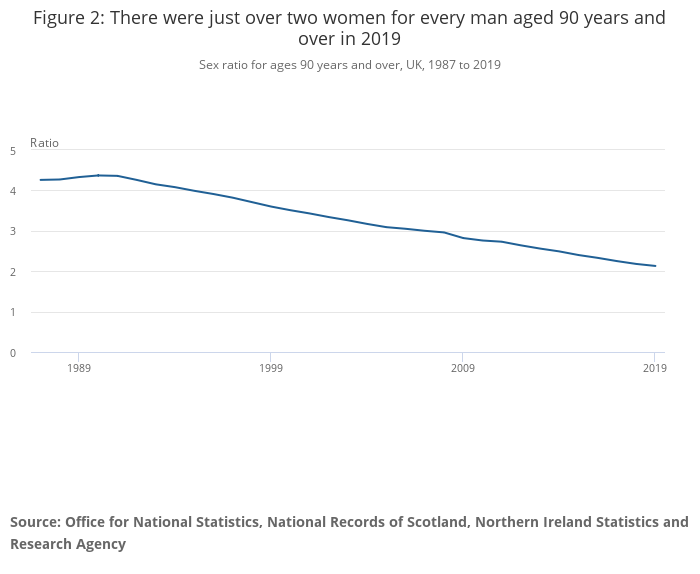
There have been quite a few changes. There are still more women than men in NEW, although the overall ratio has reduced from 2.7:1 in 2011 to around 2:1 in 2019 (see below). The NEW population, which was somewhere between the sizes of Malta’s and Cape Verde’s full population in 2011, has now just passed that of Western Sahara and has its sights firmly set on passing Luxembourg’s population next.
The population of NEW is still growing far more quickly than that of England and Wales, or indeed the UK, with a 25% increase between 2011 and 2019. However, with the NEW population you need to look beyond just improvements in public health and medical advances to the time at which they were being born. For instance, the number of people alive at almost every age from 90 years and above was higher in 2019 than in 2018, but with by far the largest increase at age 99 years (62.2%). This was caused by a big increase in births from the second half of 1919, compared to the previous year, as a result of the end of World War 1!
The bulletin ends with a sombre reminder that, although we would normally expect the large increase in those aged 99 years in 2019 to translate into a record number of centenarians in 2020, other factors, particularly the COVID-19 pandemic, are likely to have had a significant impact. COVID-19 deaths are highest for the 85 years and over age group. Public Health England have calculated excess deaths in the over 85 population at 11,656 between 21 March and 18 December 2020 (with 13,844 categorised as COVID deaths, suggesting a drop in excess deaths from other causes). This compares with the 2019 NEW population of 605,181, an increase of 21,157 on 2018.