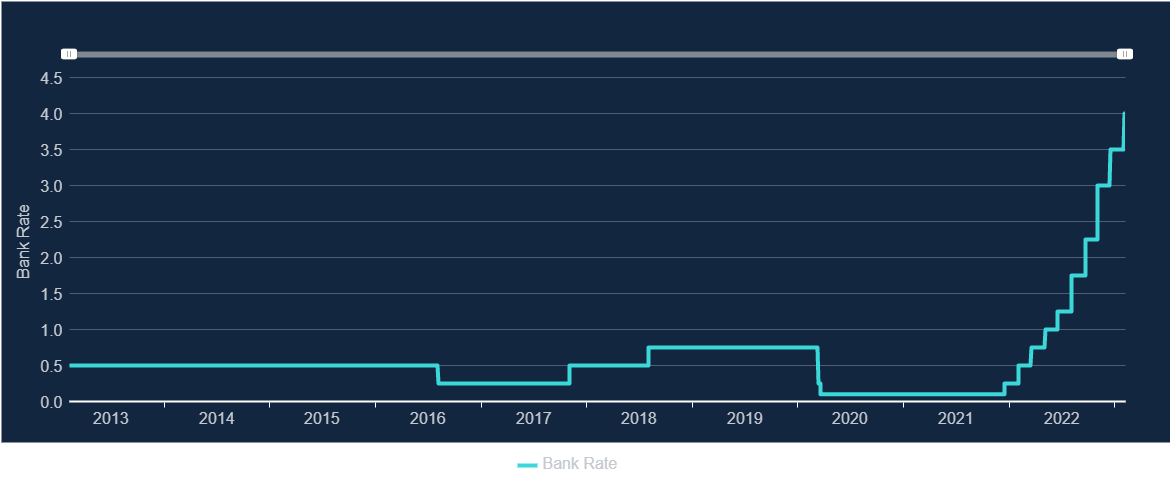
There have been a lot of predictions already for 2015. The Chartered Institute for Personnel and Development predicts employment in the UK increasing by half a million, GDP growth of 2.4% and earnings growth of between 1% and 2%, ie keeping its predictions reasonably close to what happened in 2014 and/or what the OBR, OECD and IMF are predicting. The annual FT economists’ survey resulted in an average conclusion amongst 90 economists that GDP growth would increase from 2.4% pa to 2.5% pa around election time and then on to 2.6% pa soon after. I could go on but I think you get the general idea – small changes around current economic statistics with a remarkable level of agreement amongst the experts. It’s enough to make you want to use these predictions to populate your models with, which is of course the general idea.

But before you get any idea that these people know more about 2015 than you do, consider what was being said about the oil price only 6 months ago in the Office for Budget Responsibility’s Fiscal sustainability report. Here is the graph:

Oil predictions

Once again, there was a trend of projecting a price rather similar to the current one and a remarkable level of agreement amongst the experts. Here is what has actually happened subsequently:

Brent crude oil price

Now I don’t want to pick on these forecasters in particular, after all the futures prices indicated that these views were the overwhelming consensus. But the oil price is a fundamental indicator in most economic models – Gavyn Davies details how the latest fall in oil prices has changed his economic forecasts here – with implications for inflation and GDP growth, and dependent upon predictions about many other areas of the political economy of the world which impact supply (eg OPEC activity, war in oil-producing areas) and demand (eg global economic activity). So an ability to see a big move in oil prices coming would seem to be a clear prerequisite for being able to make accurate economic forecasts. It seems equally clear that that ability does not exist.

Economic forecasts generally tell us that things are not going to change very much, which is fine as long as things are not changing very much but catastrophic over the short periods when they are. Despite the sensitivity testing that goes on in the background, most economic and business decisions are taken on the basis that things are not going to change very much. This puts most business leaders in the individualist camp described here, ie a philosophical position which encourages risk taking. Indeed even if some of the people advising business leaders are in the hierarchist camp, ie believing that the world is not predictable but manageable, to anyone with little mathematical education this is indistinguishable from an individualist position.

The early shots of the election campaign have so far been dominated by the Conservative Party branding Labour’s spending plans (which to the extent they are known appear to involve quite severe fiscal tightening, although not as drastically severe as Conservative ones) as likely to cause “chaos”, while the Labour Party wants to wrap itself in the supposed respectability of OBR endorsement of their economic policies. Neither of them has a plan for another economic crisis, which concerns me.

What are desperately needed are policies which are aimed at reducing our vulnerability to the sudden movements in economic variables which we never see coming. We should stop trying to predict them because we can’t. We should stop employing our brightest and best in positions which implicitly endorse the assumption that things won’t change very much because they will.

What sort of an economy would it have to be for us not to care about the oil price? That’s what we need to start thinking about.

The announcement by the Office of Qualifications and Examinations Regulation (Ofqual), the UK schools examination regulator, of the new grade structure for GCSEs is explained on their website by their Chief Regulator Glenys Stacey as follows:

For many people, the move away from traditional grades, A, B,C and so on, may be hard to understand. But it is important. The new qualifications will be significantly different and we need to signal this clearly. It will be fairer to all students that users of the qualification will be able to see immediately whether they did the new or a previous version of the GCSE. The new scale will also allow better discrimination between the higher performing students.

This is a big claim, which is not supported by any evidence I have seen. As Dylan Wiliam pointed out as long ago as 2001, the available data suggest that a student receives the grade that their achievement would merit only around 65% of the time. This is very close to the proportion of the time a random variable (which I think is how an examination mark needs to be treated) with a Normal Distribution falls within one standard deviation either side of its expected value. For mathematics, grade boundaries in 2014 were about 15% apart (80% A*, 65% A, 50% B, etc).

Therefore the narrowing of the grade boundaries the new system ushers in, now helpfully illustrated by Ofqual, will merely introduce more randomness to the grading process amongst higher performing students.

Ofqual

If the distribution of marks really is normal, a replacement of a 15% grade width by one closer to 10% would be expected to reduce that 65% accuracy to closer to 50%, ie you will be as likely to get the wrong grade as the right grade. This does not look like progress to me. Ofqual are, however, undaunted:

We realise introducing the new GCSEs alongside other changes will be challenging for schools, teachers and students. But the prize – qualifications that are better to teach, better to study, better assessed and more respected – will be worth it.

I remain to be convinced.

I ask this question because:

  • I have just read The Spirit Level by Richard Wilkinson and Kate Pickett, and am convinced by their arguments and evidence that inequality lies at the root of most of the social problems we have in the UK; and
  • As a scheme actuary, I persuaded myself that I was facilitating a common good, namely the provision of good pensions to people who might not otherwise have them to as high a level and for as long as possible given the economic conditions of the sponsors. The introduction of the Pension Protection Fund reduced the importance of the scheme actuary role, by mitigating the impact of sponsors not meeting their obligations, but still left a job I felt was worth doing. However, it now seems to me that, if pensions are not tackling inequality or even exacerbating it, they might be doing more harm than good.

First of all, I strongly recommend the Equality Trust website, which has a number of graphs showing the links between inequality and various social ills. One example, showing the relationship between inequality and mental illness, is set out below.

Equality Trust graph

So what is the evidence on inequality and pensions? Certainly inequality, as measured by the Gini coefficient, in this case after a reduction for housing costs, has increased markedly in the UK since the 1960s.

Gini over time

While the proportion of private pension provision since 1997 as a percentage of the workforce has fallen (courtesy of the Office for National Statistics).

ONS workplace pensions

But is there much of a correlation between them? Well there is a weak negative correlation between the Gini coefficient and the percentage in workplace pensions as a whole.

Gini v workplace pensions

And a rather stronger one when we just look at defined benefit (DB) pension scheme membership.

Gini v DB scatter

Neither of these are particularly strong correlations. Any impact by workplace pensions on inequality is likely to be limited of course, because they are in general structured (via final salary formulae in the case of DB, and employer and employee contributions as a percentage of salary in the case of defined contribution (DC)) to preserve relative incomes in retirement, even if not absolute differentials. However, moving now to the OECD statistics website, we can look at the retirement age community as a whole and compare their relative inequality with that of the working age population.

Turning to the working age population first, we can see below that the UK is a very unequal society compared to a range of rich countries, although less so than the US.

Gini working age

data extracted on 15 Aug 2014 15:52 UTC (GMT) from OECD.Stat

On the other hand, we get a very different picture if we consider the UK’s over 65 population, where the level of inequality is well below that of the US, and broadly comparable with the other major EU states.

Gini retirement age

data extracted on 15 Aug 2014 15:52 UTC (GMT) from OECD.Stat

Clearly this is not primarily down to private pension provision, but the more redistributive state pension and other benefits. However, at least the weak correlations we saw previously suggest that private pensions have not made inequality any worse and possibly slightly mitigated against it.

I think we can do better than this: after all we had inequality levels equivalent to current Norwegian levels back in the early 60s (which is why I included them in the international comparisons above). So the news that pensions tax relief is likely to be provided at a 30% rate for all after the election rather than reflecting the current tax bands is not, in my view, the cause for gnashing of teeth as the Telegraph and others believe but actually a good thing. After all, the Pensions Policy Institute have shown that 2/3rds of all tax relief is going to those earning over £45,000 pa.

One of the clear conclusions of the research carried out in The Spirit Level and elsewhere is that reducing inequality in society benefits every group in it, including those who are redistributed away from. Pension provision has its part to play in this.

And 30% tax relief does not seem like too high a price to me.

From time to time I get asked about my banner header showing successive Office of Budget Responsibility (OBR) forecasts for GDP growth against actual GDP growth and, in particular, what has happened since. The OBR produces its forecasts twice a year, in March and December, and the latest one is here. However I have resisted updating my banner to date for a number of reasons:

  • The statement that economic forecasts are wildly inaccurate has become a truism that, in my view, no longer needs additional evidence in support; and
  • To be completely honest, once actual GDP growth started to increase (as was inevitable eventually, and particularly once the Government’s austerity boot’s grip on the economy’s neck started to weaken), the graph no longer looked quite as amusing.

However, I have recently started to question the first of these assumptions so here is an updated graph:

OBR update 2014

Notice how the point at which growth peaks and starts to fall is moving closer with each new forecast. This is as much a part of their models as putting back the upward path a quarter or two with each successive forecast was while that path was still actually falling. Be assured that the OBR will not forecast the next fall before it actually happens.

What concerns me is the forecast consensus which is starting to build around 2014-2018 of GDP growth between 2% and 3% pa (currently narrowing as a forecast to 2.5% – 2.8% pa). This is despite the OBR themselves making no more than a claim of 20% probability of growth staying in this range, as the following fan chart shows:

OBR fan chart

However I don’t see this fan chart turning up in many news reports and therefore my concern is of an election campaign fought under the illusion of a relatively benign economic future. I think it is likely to be anything but, particularly as the Government is likely to stick the boot back in post election whoever wins.

There seems to be no chance of stopping the OBR and others publishing their forecasts, too many people seem to value the power of the story-telling however implausible the plot, so the only course available seems to be to rubbish them as often as we can. That way it may just be possible, despite all the noise about predictions of economic recoveries and collapses we cannot possibly foretell being used to try and claim our political support more generally, to keep in mind that we know zero. And make better decisions as a result.

Trust me. I'M AN ACTUARY!

Trust me. I’M AN ACTUARY!

I commented on the Pensions Regulator’s new code of funding in a recent post. The reason I am returning to it so soon is that a good friend of mine has pointed out a rather important, but subtle, aspect of the new code which I had missed. It goes to the heart of what we should expect from a professional in any field.

Experts and the Problem of P2C2Es

In 1990, while still in hiding from would-be assassins keen to implement Ayatollah Khomeini’s fatwa, Salman Rushdie wrote a book for his son called Haroun and the Sea of Stories. This introduced the idea of P2C2Es or Processes Too Complicated To Explain. These were how awkward things, like the fact that the Earth had a second moon which held the source of all the world’s stories, were kept hidden from ordinary people. All the people who worked on P2C2Es were employed at P2C2E House in Gup City under a Grand Comptroller. When I read it to my son a few years later I enjoyed the story of very clever people conspiring against the general public as a fairy tale.

Since 2008, it has become increasingly clear that this is no fairy tale. Whether you are looking for the cheapest quote for insuring your life, house or your car; a medical opinion about your health; an investment that meets your needs: it is a P2C2E.

Malcolm Gladwell and others make the case that expert failure is what we should really fear, when important things rely on experts not making mistakes doing things that most people do not understand. The inability to challenge expert opinion has cost us all a lot of money in the last few years. We should stay clear of P2C2Es whenever we can in my view. Professionals should present evidence and the intuitions gained from their experience, but leave the decisions to people with skin in the game.

Other professionals disagree with this. There is, from time to time, a push to get rid of juries in cases where the evidence is thought too complicated (eg fraud) or too dangerous to make public in even a limited way (eg terrorism). Some of these succeed, others don’t. There are also frequent political arguments about what we should have a referendum on, from Scottish independence (got one if you’re Scottish) to membership of the EU (one is promised) to recalling your MP mid-term (so far no luck on this one).

There is a similar divergence of opinion amongst actuaries. Since the Pensions Regulator’s first code of practice for funding was launched, in 2006, the scheme actuary’s role has been clearly set out as one of adviser to the scheme trustees and not, other than in the rare cases it was cemented in the scheme rules, a decision maker. However there are actuaries who look back wistfully to the days when they effectively set the funding target for pension schemes and all parties deferred to their expertise. I am not one of them.

Because this was really no good at all if you were a trustee expected to take responsibility for a process you were never really let in on. The arrival at a contribution rate or a funding deficit for a scheme funding on a basis presented to them as a fait accompli was to many trustees a P2C2E. We risk returning to those days with the new code of funding.

What this has to do with pensions

Compare the wording of the new Code of Practice for pension scheme funding with the previous one:

2006 code

The actuary is not passing an opinion on the trustees’ choice of method and assumptions.

2014 code

Trustees should have good reasons if they decide not to follow the actuary’s advice. They should recognise that if they instruct their actuary to certify the technical provisions and/or schedule of contributions using an approach which the actuary considers would be a failure to comply with Part 3, the actuary would have to report that certification to the regulator as the regulator considers such certification to be materially significant.

Where Part 3 refers to the funding regulations for actuarial valuations. Previously actuaries who were unable to provide the required certification of the calculation of the technical provisions or of the adequacy of the schedule of contributions had to report the matter to the regulator only if a proper process had not been followed or the recovery plan didn’t add up to the deficit. It was thought that going any further would involve passing an opinion on the trustees’ choice of method and assumptions.

Will the new code make schemes better funded? In some cases perhaps, but at the cost of moving scheme trustees into a more passive role where they do not feel the same level of responsibility for the final outcome. It is the difference between roads where cars are driven by people concerned with road safety and the ones we have where drivers are primarily concerned with not setting off speed cameras. The general level of safety is reduced in both cases, with the further danger that this passivity will trickle into other areas of trustee responsibility. And the risk to the schemes of the group think of scheme actuaries (a relatively small group of professionals who tend to all cluster around the same schedule of continuing professional development (CPD) events) is massively increased.

Ha-Joon Chang famously said never trust an economist. Is it any less dangerous to trust an actuary under these circumstances?


The response to the consultation on the Budget pension proposals has much to welcome in it. The Government appears to have listened to the arguments that their concerns about the impact on financial markets of the reforms bordered on paranoia, and have agreed to continue allowing private sector defined benefit schemes and funded public sector schemes to process transfers. They have committed to continuing to consult on the idea of extending the new freedoms to defined benefit schemes themselves, which would avoid the need for a lot of expensive fee-generating transfers into defined contribution arrangements.

And yet. The section on the guaranteed guidance suggests that, despite the opinions expressed in the consultation, the Government is still primarily focused on guidance “at the point of retirement” despite the probability that this is likely to become just one of the criticial retirement phases following these reforms. And the reform of pensions legislation seems overly concentrated on facilitating innovations in annuities rather than allowing the level legislative playing field between different forms of pension provision that would be required to prevent the death of defined ambition.

But the real problem I have with the consultation response concerns the minimum pension age. A point i have made before. Currently 55, the Government has decided to increase this to 57 by 2028. I think this is a mistake. Why promote freedom in the form you take your benefits but not when you take your benefits?

And the need for this freedom is evident. The latest Office of National Statistics (ONS) release on healthy life expectancy at birth by local authority suggests that, in many areas, this may condemn people to work until they are sick.

Here is the graph for males in local authorities where the healthy life expectancy (HLE) is less than the state pension age (SPA):

HLE males

And the equivalent graph for females:

HLE females

For each local authority area you need the red line to be above the minimum pension age to be 95% sure the average member of its population is able to retire, even if only partially, in good health. For the males, Blackburn, Blackpool, Islington and Tower Hamlets already have red lines below a minimum pension age of 55. Increase this to 57 and the number of red lines below multiplies alarmingly. And this is just an average – many will have life expectancies well below this.

Of course we assume life expectancy will increase between now and 2028, but healthy life expectancy? One of the problems is that it has not been measured for very long, and there have been disagreements about how it should be measured. As the King’s Fund shows, in 2005 a change to the methodology caused healthy life expectancy to plunge by 3 years, suggesting a rather optimistic approach previously. The ONS methodology is set out here.

It seems clear to me that there is sufficient doubt around how long people around the UK are expected to remain in good health for the Government to pause before raising the minimum pension age. After all we already know how those in ill health are likely to be treated if they try to claim they can’t work.

ATOS

A flower for every person that died within 6 weeks of ATOS finding them fit for work

At times it all sounds like the joke about the visitor to Hell being shown by their PR department how the bad press had been much exaggerated. There were concerts on Wednesday afternoons and coffee mornings on Fridays, the manure was only ankle deep in many places and the eternal flames were optional. However, on accepting his place for eternal damnation, another senior devil he had never seen before walked in to announce “Ok, tea break’s over. Back on your heads!”

It would seem that tea break is over.

I have written about false positives before, as have many others, but the media stories keep on coming. The latest reports, by the BBC most notably but also carried by the New Scientist and a number of other sources, display such an unfortunate ignorance of the issue of false positives that they risk raising false fears in the minds of sufferers of mild cognitive impairment and their families.

The BBC article makes a number of statements:

1. British scientists have made a “major step forward” in developing a blood test to predict the onset of Alzheimer’s disease.

2. Research in more than 1,000 people has identified a set of proteins in the blood which can predict the start of the dementia with 87% accuracy.

Neither of these statements are true. What the new test can do is guess right about patients with mild cognitive impairment (MCI) going on to develop Alzheimer’s disease (AD) within a year in 87% of cases. What it cannot do is predict whether someone with MCI will develop AD with 87% accuracy. The research article is here.

It all comes down to the likelihood of someone with MCI developing AD. It does not help that there is no general agreement of a definition for either term. The research reported on used the Petersen criterion for MCI. The likelihood of people within the population with MCI developing AD each year is again unknown, but 6 quite small studies (a total of 476 people across all the studies, with different average ages and sample sizes among the groups) carried out in North America analysed by Petersen et al in 2001 suggested that it lay between 6% and 25%, with an overall average rate of 12.5%.

So let’s assume that it is 12.5%. In a population of 1,000 people with MCI, we would expect 125 to develop AD. The test will identify 109 of them on average. Unfortunately, assuming the same accuracy rate of 87%, it will also give false positives for 13% (or 114) of the 875 not expected to develop AD in any particular year. That means that, of the 223 who test positive, less than half (49%) are actually expected to develop AD within a year. As the NHS choices website points out, in one of the few sceptical articles I could find, this is no better than tossing a coin.

If we assume the probability of moving from MCI to AD is at the higher bound of 25%, the positive predictive value (or PPV, as it is known) increases to 69%. However if we assume the lower bound of 6%, the PPV falls to 30%. In other words, if we get a positive blood test for this panel of 10 proteins, we currently do not know whether it is twice as likely to be a true positive than a false positive, or twice as likely to be false as true. Or anywhere in between.

Despite this, Dr Eric Karran, director of research at Alzheimer’s Research UK (clearly no conflict of interest there in promoting stories which promote the idea that Alzheimer’s research is highly effective) is widely reported as describing the study as a “technical tour de force”, while also acknowledging that the current accuracy levels risked telling many healthy people they were on course to develop Alzheimer’s.

In some reports it was pointed out that it was unlikely that the test would be used in isolation if it eventually made its way into clinics. A positive result could be backed up by brain scans or testing spinal fluid for signs of Alzheimer’s, they said. However if the test is no more predictive than a coin toss that is hardly encouraging.

There was more from Dr Karran: “This gives a better way to identify people who will progress to Alzheimer’s disease, people who can be entered into clinical trials earlier, I think that will increase the potential of a positive drug effect and thereby I think we will get to a therapy, which will be an absolute breakthrough if we can get there.”

This is simply untrue. Clearly it is important to support research into therapies for Alzheimer’s disease, but in raising funds for this the ends do not justify any means. Additional funding gained through false claims for any particular discovery will come at the expense of funding in other equally important areas. Like agreeing a definition of MCI and AD for instance, or better data on the transition probabilities from MCI to AD at different ages, without which a lot of the more laboratory-based research will be a waste of time as it will be unclear how best to apply it.

So let’s be careful how we report these things. People’s hopes and fears are at stake.

Another month, another consultation. This time it’s the Pension Protection Fund’s (PPF) turn. I last wrote about their plans five months ago. Since those dark days things seem to have moved on a bit: there is now a proposed model and a timetable for implementation.

And there is much to cheer here. One of the main criticisms consistently levelled at the current system was that it was hard for employers to understand how to improve their score, without handing over money to Dun & Bradstreet (D&B) for reports and fees to advisers to interpret them. Here, at last, is a model which is not owned by the credit agency running it, something I have long argued for. This means that the scores and data underlying them can be monitored by companies much more easily, and in more detail, by a free web-based portal.

Unfortunately the PPF are risking undermining this transparency for large companies by considering a credit rating override, where the insolvency risk would be determined by the company’s credit rating score instead. In my view this idea should be resisted.

Other successes are the moves to stop ABCs from getting too much credit for their complex structures, and the use of past data to review the treatment of Type A contingent assets (although they have chickened out of removing these altogether) and the last man standing levy reduction.

In all there were nine success criteria which were used to make the decision on the model used, but the one given the greatest weighting was “predictiveness”. According to the Oxford English Dictionary this word does not exist, but I take it to mean “degree to which insolvency risk assessed predicts the number of actual insolvencies for a given score”. Of course, it is nothing of the kind that has been assessed. They have taken the last eight years of data and compared the proportion at each score level with the percentage of insolvencies expected (they say “predicted”), and wrapped up the differences in an eye-catching diagram using the Gini coefficient (this is usually used to talk about inequality, when you are looking to minimise it, but here they are trying to allocate levies where the risk lies and therefore trying to maximise the distance from an even distribution).

PPF levy GiniAll a high Gini score means in this context is that the selected model fits well with the actual insolvencies over the last eight years. The danger is that the model has been over-fitted to eight years’ data, a rather untypical period for the economy in many ways and possibly not very indicative for what lies ahead until 2030 (when the levy is supposed to end). Fortunately they are proposing to continue monitoring how well the “predictiveness” works in future.

The other area of the consultation where I take issue is the PPF’s opposition to having a transition period. Their impact assessment shows that 10% of schemes are expected to see an increase of over £50,000 in their levy as a result of these changes, with 200 of them seeing an increase of over £200,000. It therefore seems odd that they should oppose a transition period to allow companies to better cope with the long term move to a fairer allocation of levies. The main argument they give for this is that it would be a cross subsidy. But so is the restriction on the increase in levy by moving down a band to 60%, which I can see much less justification for and which results in bands 2 and 3 underpaying for their insolvency risk and bands 5 and 6 overpaying for it.

But overall a broad welcome, as I will be telling them. Let’s see what survives the consultation (it ends at 5pm on 9 July).

My consultation responses are as follows:

Chapter 2

1. Do you agree that we should seek to maintain stability in the overall methodology for the levy, only making changes where there is evidence to support them?

Yes.

Chapter 3

2. Do you consider that the definition of the variables in the scorecards is sufficiently precise to provide for consistent treatment?

Yes.

3. Do you agree that it is appropriate to re-evaluate the model to ensure that it remains predictive?

Yes.

4. Do you have comments on the design of the “core model” developed by Experian?

Very pleased that the PPF have decided to move away from a proprietary model, where large parts of its operation are kept secret through commercial confidentiality arguments.

5. Do you agree with the success criteria set out by the Industry Steering Group and that the PPF-specific model developed by Experian is a better match with them than Commercial Delphi?

Yes.

6. Do you agree that it is appropriate to use the separate scorecard developed by Experian not-for-profit entities, even though this requires an extension of the data set used to generate the scorecard?

Yes.

7. Do you have comments on the approach to the rating and proposed identification of not-for profit entities, developed by Experian?

No.

8. Are there other public sources of data that Experian should consider extending coverage to?

No.

9. Do you agree with the proposed data hierarchy?

Yes.

Chapter 4

10. Do you favour a credit rating over-ride?

No. This would undermine the gain in transparency offered by the PPF-specific model.

Chapter 5

11. Do you agree with our proposed aims for setting levy rates?

I am concerned about the cross subsidy implicit in the 60% limit on levy differences between adjacent bands.

12. Do you agree it is appropriate to divide the entities with the best insolvency probabilities in to a number of bands, to ensure that the cliff-edges between subsequent bands are limited, or do you favour a broad top band?

Cliff edges are unavoidable with this model. I think there is a strong argument for having slightly fewer slightly bigger ones. This would remove many of the small band movements at the top end, which are relatively unproductive for risk management.

13. Do you agree with the proposed 10 levy bands and rates?

Not completely. Bands 2 and 3 appear to be underpaying for their insolvency risk, and bands 5 and 6 appear to be overpaying.

14. Do you agree that for 2015/16 levy year insolvency probabilities are averaged from 31 October 2014 to 31 March 2015?

Yes.

Chapter 7

15. Do you support transitional protection for those most affected by the move to the new methodology, recovered through the scheme-based levy?

Yes.

Chapter 9

16. Do you agree that the appropriate route to reflecting ABC’s in the levy is to value them based on the lower of the value of the underlying asset (on employer insolvency) after stressing or the net present value of future cashflows?

Yes. I do not accept that ABCs’ primary objective is to reduce risk. The changes proposed appear to ensure that they do not get overly favourable treatment in terms of levy reduction.

17. Do you agree that a credit should only be allowed where the underlying assets for the ABC is UK property? Do you have any comments on the example voluntary form/required confirmations?

Yes.

18. Do you support the proposal to make the certification of contingent assets more transparent, through requiring certification of a fixed amount which the guarantor could pay if called upon?

Yes.

19. Do you have any comments on the proposed revised wording for trustee certification for Type A contingent assets?

The revised wording seems appropriate.

20. Do you agree with our proposals to adjust guarantor scores to reflect the value of the guarantee they are potentially liable for? Do you favour the adjustment being achieved by a factor being applied to the guarantor’s Pension Protection Score or by an adjustment of the guarantor’s levy band?

This looks like a very complicated approach designed to put off sufficient schemes from using Type A contingent assets so that there will not be a very large squeal when they are removed altogether.

21. What other measures do you suggest to ensure that, where a scheme certifies information about a contingent asset to the PPF, any resulting levy reduction is proportionate to the actual reduction in risk?

I think the proposals are complicated enough.

22. Do you agree with the proposed form of confirmation when Last Man Standing scheme structure is selected on Exchange?

Yes.

23. Do you agree with the revised scheme structure factor calculation proposed for associated last man standing schemes?

Yes.

I have been reading Ha-Joon Chang’s excellent book Economics: The User’s Guide after listening to him summarising its thrust at this year’s Hay-on-Wye Festival of Literature and the Arts. It is very disarming to meet an economist who immediately tells you never to trust an economist, and I will probably return to his thoughts on the limitations of expert judgement in a future article.

But today I want to focus on his summary of the major schools of thought in economics, and what the implications might be for actuaries. Chang’s approach is that he does not completely subscribe to any particular school but does not reject any either. He bemoans what he sees as the total domination of all economic discussion currently (and therefore also all political discussion about running the economy) by neoclassical economists. I think actuarial discussion may suffer from a similar problem.

So what is neoclassical economics? Well it has become almost invisible to us due to its omnipresence, in the way fish don’t see the water they swim in, but its assumptions may surprise you. It assumes that all economic decisions are at an individual level, with each individual seeking to maximise what is known as their utility (ie things and experiences they value). The idea is that we self-interested individuals will collectively make decisions which, within the competitive markets we have set up, result in a socially better outcome than trying to plan everything. This approach has become a very conservative outlook (ie interested in preserving the status quo) in Chang’s view ever since it was further developed to include the Pareto principle in the early 20th century, which says that no change in economic organisation should take place unless no one is made worse off. This limits the scope for redistribution within a society, which can lead to the levels of inequality we see now in parts of the developed world which many are becoming increasingly concerned about, Thomas Piketty included.

Arguments between neoclassical economists in Chang’s view tend to be restricted to ones about how well the market actually works. The market failure argument says that there is a role to play for governments in using taxes and regulations (negative externalities) or in funding particular things like research (positive externalities) to mitigate the impacts of markets, particularly in areas where market prices do not fully reflect the social cost of particular activities (eg pollution on the environment). Another criticism made of neoclassical economics is that it does not allow properly for the fact that buyers and sellers do not have the same level of information available to them in many markets, and therefore the price struck is often not the one which would lead to the best outcome for society as a whole. So the more “left wing” neoclassicalism requires more market regulation to protect consumers and the environment they live in.

The more “right wing” neoclassical response to this is that people actually do know what they are doing, and even build in the likelihood that they are being conned due to asymmetric information in the decisions they make. The government should therefore reduce regulation and generally get out of the way of wealth-creating business. This form of neoclassicalism views the risk of government failure as much greater than that of market failure, ie even if we have market failure, the costs of government mistakes will inevitably be much greater.

And if you draw a line between those two forms of neoclassicalism, somewhere along that line you will find all of the main UK political parties and pretty much all economic discussion within the financial services industry.

And, on the whole, it tends to circumscribe the role that actuaries play in the UK.

One of the major drawbacks of neoclassical theory is that is assumes risks can be fully quantified if we only have a comprehensive enough model. Actuaries are predominantly hierarchists, who believe that they can manage the inequalities which flow from neoclassical theory via collectivist approaches, like insurance policies and pension schemes, and protect individuals and indeed whole financial systems from risk. Since Nicholas Nassim Taleb and others made so much money from realising that this was not the case in 2008, this has probably been neoclassicalism’s most obvious flaw, and the one which has given rise to the most discussion (although possibly not so much change to practice) amongst actuaries.

But there are others. Neoclassicalism assumes that individuals are selfish and rational, both of which have been persuasively called into question by the work of Kahneman and others, who have shown that we are only rational within bounds and make most of our decisions through “heuristics” or rules of thumb. Actuaries have tried to reflect these views, some of which were originally developed by Herbert Simon in the 40s and 50s, particularly in the way that information is communicated (eg the recent publication from the Defined Ambition working group), but have very much stayed at the microeconomic level (very much, according to Chang, like much of the Behaviouralist School themselves) rather than exploring the implications of this theory at a macroeconomic level.

Neoclassical theory is also much more focused on consumption than production, with its endless focus on markets of consumers. One alternative approach is that proposed by the Neo-Schumpeterian School, which rightly points out that, in many markets, technological innovation is considerably more important than price competition for economic development. The life-cycle of the iphone, from innovation to temporary market monopoly to the creation of a totally new market in android phones is a case in point. Actuaries have done relatively little work with technology firms.

Another school of economic thought which is much more focused on production is the Developmentalist Tradition, which believes governments can improve outcomes considerably by intervening in how economies operate: from promoting industries which are particularly well-linked to other industries; to the protection of industries which develop the productive capability of the economy, particularly infant industries which might get smothered at birth by the more established players in the market. This tradition clearly believes that the risk of government failure is less than the potential benefits of intervention. The failure of productivity to pick up in the UK since 2008 has been described as a “puzzle” by the Bank of England and other financial commentators. Perhaps some clues might lie outside a neoclassical viewpoint.

The Institutionalists have looked at market transaction costs themselves, pointing out that these extend way beyond the costs of production, and could theoretically encompass all the costs of running the economic system within which the transactions take place, from the courts to the police to the educational and political institutions. They have suggested that this may be why so much economic activity does not take place in markets at all, but within firms. I think actuaries have started to engage with failures in pricing mechanisms recently, particularly where these have environmental consequences such as in the case of carbon pollution and the implications for the long term valuations of fossil fuel reserves on stock markets.

The Keynesians I have written about before. They are probably the most opposed to the current austerity policies, pointing out how, if a whole economy stops spending and starts saving when in debt, as an individual would, the economy will stay in recession longer and recovery (and therefore the possibility of significant deficit reduction) will be slower. The coalition government in the UK have neatly proved this point since 2010.

I could go on, about the Classical or Marxist Schools which have been largely discredited by historical developments over the last 200 years, but which still have useful analysis of aspects of economics, or the spontaneous order of the markets believed in by the Austrian School. However my point is that I think Chang is right to highlight that there is a wider range of economic ideas out there. Actuaries need to engage with them all.

The Pensions Regulator has finally released its response to its consultation on regulating defined benefit pension schemes along with the simultaneous release of the final new code on funding defined benefits, its latest annual funding statement and two new documents: the defined benefit regulatory strategy and the defined benefit funding, regulatory and enforcement policy. It’s a bit of a mixed bag.

I set out a critique of the draft proposals back in January. These boiled down to two main criticisms:

  • That the new system proposed was effectively a return to the one-size-fits all approach of the Minimum Funding Requirement, which had done so much to undermine responsible scheme funding by employers; and
  • That the focus on governance, reverse stress testing, covenant advice, etc, effectively smuggled in from EIOPA’s latest IORP Directive, was likely to be a problem for small schemes.

BFO RIP

So what has the Regulator’s response been to these criticisms? Well, on the one-size-fits-all approach which was proposed as the Balance Funding Objective (BFO), the response is comical:

  • They have changed the name of their funding objective. The BFO is now called the Funding Risk Indicator (FRI). It is otherwise unchanged. This is reminiscent of the Lenny Henry sketch at the time that Windscale was renamed as Sellafield: “In future, radiation will be referred to as magic moonbeams”.
  • They are going to keep all their risk indicators secret. I have set out below their response in full on this point.

We believe that there may be potentially significant benefits to be gained in using the FRI and publishing more detail on our risk indicators in terms of providing clarity around standards, especially for small schemes, driving consistency and providing a useful framework for evaluating impact. However, after careful consideration of the risks and benefits highlighted in consultation responses, we have concluded that we should develop further our approach to risk assessment over the next year, including our risk indicators, to make sure it is sufficiently robust to support our intended uses beyond using it, alongside our other risk indicators, to prioritise our engagement. We have decided, for the time being, not to publish in detail where we set our risk indicators (beyond a high level description) in the funding policy document or in the annual funding statement.

So how will this work? Will the Regulator display charts like this one each year?

TPR graphWill they then berate the schemes and their advisers who were so bad at guessing where their secret line was? Because be in no doubt, with the speed of the revolving door operating between the Regulator and the industry it regulates, these indicators will get out and then gradually get disseminated through the pensions industry, from the biggest consultancies (who can easily fund having their consultants on secondment to Brighton) downwards, just as the Regulator’s previous “secret” link between assessment of covenant strength and “expected” discount rate assumptions did.

And what about the problem with small schemes? This is, in my view, considerably better handled by the Regulator. However, it does all comes down to its idea of proportionality.

Proportionality

The response to the consultation states:

Many respondents were concerned that proportionality did not follow through consistently in the consultation code or it was not explained clearly how it could be applied in practice. In particular, some thought our expectations around the extent of the analysis required to assess the covenant seemed disproportionate. The concern was that it would be difficult and costly for small schemes to apply the code’s principles.

I was one of those respondents. It continues:

We have reviewed the drafting to ensure that proportionality is properly referenced and emphasised throughout. We are looking to develop additional guidance to support the final code and will consider whether the proportionality principle can be explained further through illustrative examples.

On covenant assessment, we had already made clear (under the ‘Working with advisers’ section) that trustees may chose not to commission independent covenant advice as long as they can satisfy
themselves that they are sufficiently equipped, independent and experienced to undertake the work to the appropriate standard. In the section on ‘Employer covenant considerations’, we have emphasised the need for a proportionate approach (for instance, in-depth analysis may not be necessary if the scheme is relatively small or there has been no material change in the covenant since the last review). We also stress that assessment should focus on the knowledge gaps and where value can be added. Finally, we have made clear that the scope of any covenant review will depend on the circumstances of the scheme and it is, therefore, not always necessary for trustees to consider all the factors listed in the code.

In addition the Regulator has dropped the size of employer and strength of covenant as factors for trustees to consider in deciding on what is proportionate for their schemes, realising, rightly in my view, that the absolute size of employer and strength of covenant are much less important than the relative size of employer to scheme and risks to the scheme from failures of covenant which are already mentioned.

This all seems sensible. I do, however, think they will struggle to go further in setting out what proportionality means, since the problem of defining it has bedevilled the Solvency 2 project from the beginning and has still not been fully resolved. The IORP Directive is no clearer in this respect. What the Regulator could do is make a clear distinction between schemes with less than 100 members and the rest in terms of their responsibilities under the Code, reflecting the fact that the IORP Directive does not apply to these schemes.

Small schemes and risk-based prioritisation

But perhaps they have. Concerns were raised in the consultation about considering the size of the scheme in deciding whether to subject that scheme to greater scrutiny. It was argued that smaller schemes tended to be less well administered and advised (presumably by advisers and administrators of larger schemes!), more risky than larger schemes and should receive greater regulatory scrutiny. Some also questioned the usefulness of education without what they felt was the same prospect of regulatory scrutiny. I admit that I was one of those expressing concern about a lack of scrutiny coupled with a much increased regulatory burden for small schemes before the Regulator’s latest concessions on proportionality.

In their response the Regulator defended its actions by stating that large schemes all other things being equal, are of greater concern to us as they have the greatest impact on members and risk to the system (90% of members and liabilities are concentrated in the 1,210 largest schemes). However they expect the same standards of the small schemes that they aren’t scrutinising so hard. Bearing in mind that the Regulator regulates scheme managers rather than members (and many of those small schemes have just as many trustees as the larger ones) I don’t think this is a very convincing defence, but it seems to be preferable to admitting that they are just regulating schemes that fall under the IORP Directive.

Next steps

So a big raspberry for the secret FRI and a qualified welcome for the changes on proportionality. The final code has now been laid in Parliament and is expected to come into force in the next few months, subject to the parliamentary process. So if you think that there is more than a little tweaking left to do to this legislation, you need to start lobbying now.