As Rowan Atkinson once said: “Life is one of those things that most of us find very difficult to avoid”. You would imagine that death would be similarly unavoidable, but not in all cases it would seem.
The Office of National Statistics (ONS) have just issued the latest figures (for 2012) on what they define as avoidable deaths (“mortality figures for causes of death that are considered avoidable in the presence of timely and effective healthcare or public health interventions”) and have concluded that these account for a staggering 23% of all deaths.
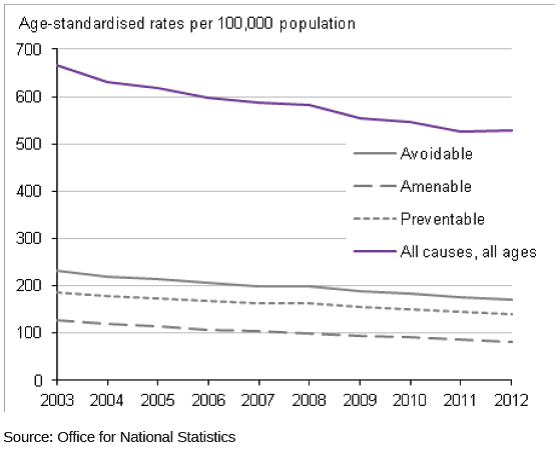 Avoidable deaths defined in this way can be further broken down into preventable deaths (ie those that can be avoided mostly or completely through public health interventions, eg traffic accidents) and amenable deaths (ie those that can be avoided mostly or completely through good quality healthcare, eg epilepsy). Some, eg ischaemic heart disease (22% of avoidable deaths in men), are seen as both.
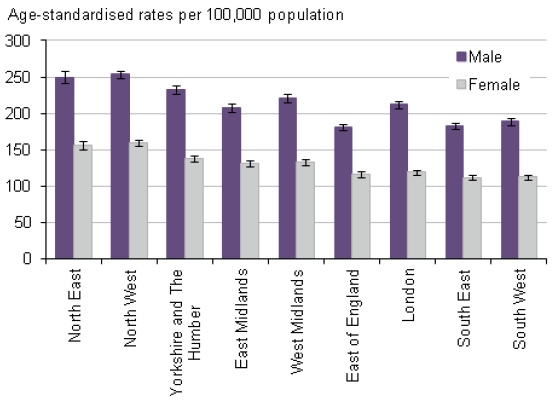
One interesting aspect of this release is the regional breakdown of avoidable deaths as a percentage. These vary from 15% in the South (outside London) to 20% in the North West for women and from 24% in the South West to 31% in London and the North for men.
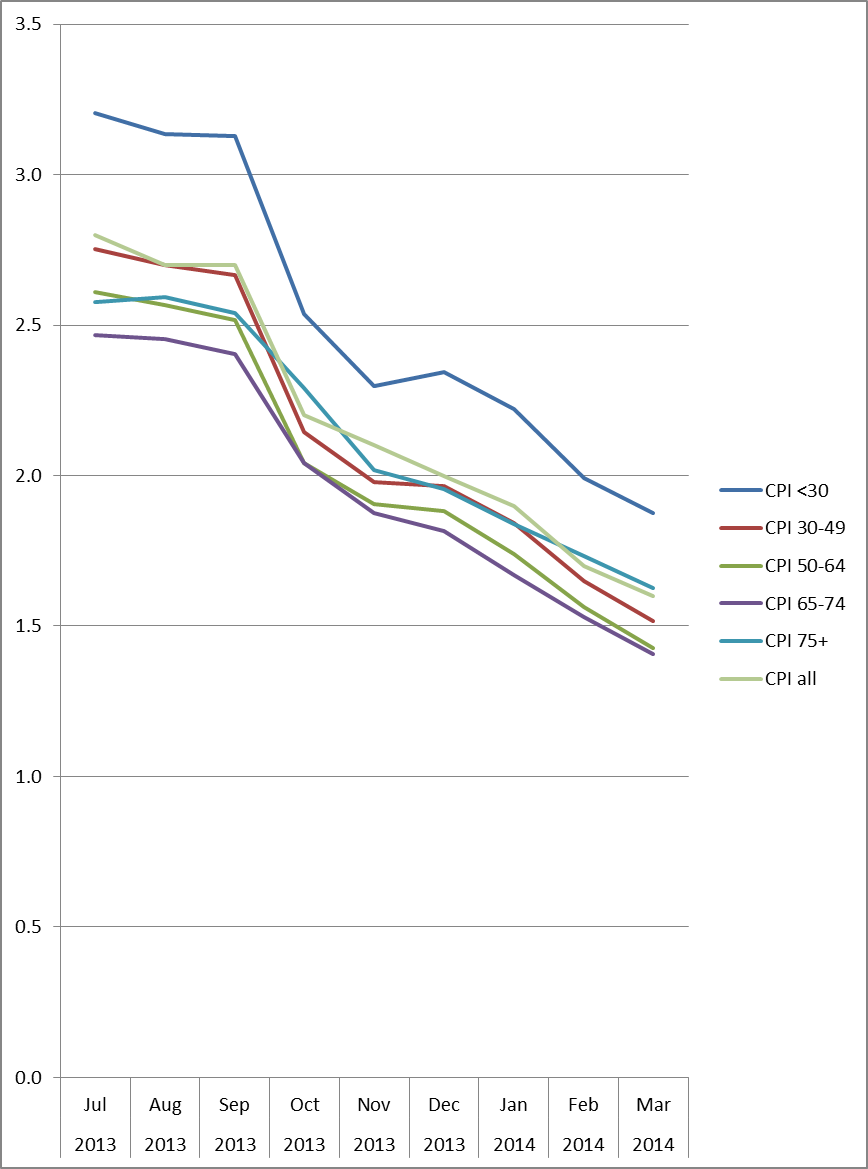
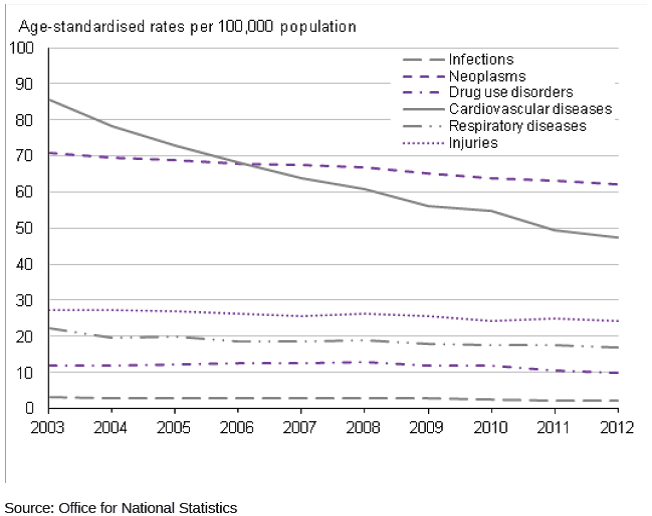
As we can see from the following graph, it is possible for the proportion of deaths by cause to change quite dramatically over time. Could this also be true for avoidable deaths by region?
The methodology for calculating the impact of improved survival rates of various conditions in terms of the number of deaths avoided is “age-standardised”, which means that we are all living in a population with the same structure as an average European population from 1976, when ABBA were in their pomp. The actual potential proportion of lives saved may therefore be more or less than 23%. This also means that some of the differences between regions could be due to how different their population structures are to ABBAland, eg there are a lot more over 65s as a proportion of the 2013 Standard Population (which the ONS should be moving to using soon) than there are in the 1976 version.
However, as David Spiegelhalter shows here, it is relatively straightforward to convert an improvement or deterioration in mortality rates into an increase or decrease in life expectancy. Making a few heroic assumptions (in this case: 1. that the most popular mortality table currently used by occupational pension schemes, but without any mortality improvements since 2002/03, is an appropriate way to estimate the effect of removing avoidable mortality on life expectancy; and 2. that the mortality is avoided equally at all ages from 65 onwards) we can therefore estimate the 7% difference for men and 5% difference for women in the degree of avoidable mortality to be equivalent to around 0.6 years for men and 0.4 years for women in the life expectancy at age 65.
If the mortality rates could therefore be improved in regions with currently the highest proportions of avoidable mortality, so that the avoidable mortality remaining was no higher than in those regions where it is currently at the lowest proportions, life expectancy at 65 would be increased in some regions by up to 0.6 years.
However, averaging by region smooths out much larger differences between postcodes (postcode mortality mapping is commonly used, eg by insurance companies in setting annuity rates). For instance, the current gap between the highest and lowest life expectancy at age 65 is 6 years for men (between Harrow and Glasgow City) and 5.5 years for women (between Camden and Glasgow City). So perhaps we should be shooting for the rather higher ambition of removing all of the avoidable mortality. If the overall average avoidable mortality of 23% could actually be avoided, this would lead to an average increase in life expectancy at age 65 of 2 years.
Finally, what about the differences between men and women? The ONS report states than “Men are more likely to die from potentially avoidable causes than women, with about 28% (67,548 out of 240,238) dying from avoidable conditions compared with 17% (44,945 out of 259,093) of women in 2012.” That 11% difference would equate to a life expectancy difference at 65 of around 1 year, which is about half of the current gap between men and women at 65. Women living longer than men? It would seem that it’s only half inevitable.