The Treasury is consulting on the tax relief that should be available in future for pension schemes and their members. The principles for any reform that it has set out are:
- it should be simple and transparent;
- it should allow individuals to take personal responsibility;
- it should build on the success of automatic enrolment; and
- it should be sustainable.
Simplicity, transparency, personal responsibility and sustainability mean different things to different people, which means that the precise meaning of these principles will depend on the politics of the people proposing them. However the words themselves are difficult to argue with, which is presumably why they have been chosen.
It has then set out 8 questions that it would like answered in response to its consultation. The consultation ends on 30 September. I have set out my responses below. I hope that they will sufficiently incense one or two more people into making their views heard, before the chance disappears.
1. To what extent does the complexity of the current system undermine the incentive for individuals to save into a pension?
On this question I think I agree with Henry Tapper at the Pension PlayPen. He says the following:
In summary, millions of pounds of tax relief is wasted by the Treasury helping wealthy people avoid tax…Incentives are available to those on low earnings who pay no tax, but this message is not getting through, we need a system that resonates with all workers, not just those with the means to take tax advice.
I then think I agree with the following:
The incentive should be linked to the payment of contributions and not be dependent on the tax or NI status of the contributor – if people are in – they get incentivised.
That would certainly make the incentive to the pension scheme member clearer and potentially easier to understand. The other simplification I would support would be the merging of income tax and national insurance contributions – many of the sources I have referenced below are trying to solve problems caused by the different ways these two taxes are collected. This simplification would be an essential part of any pension reforms in my view.
2. Do respondents believe that a simpler system is likely to result in greater engagement with pension saving? If so, how could the system be simplified to strengthen the incentive for individuals to save into a pension?
This is the invitation to support TEE (ie taxed-taxed-exempt, the same tax treatment as for ISAs). I have up until now been persuaded by Andrew Dilnot and Paul Johnson’s paper from over 20 years ago that this was not a good idea. This pointed out that the current EET system:
- Avoids problems with working out what level of contributions are attributable to individuals in a DB system
- Does not discourage consumption in the future relative to consumption now
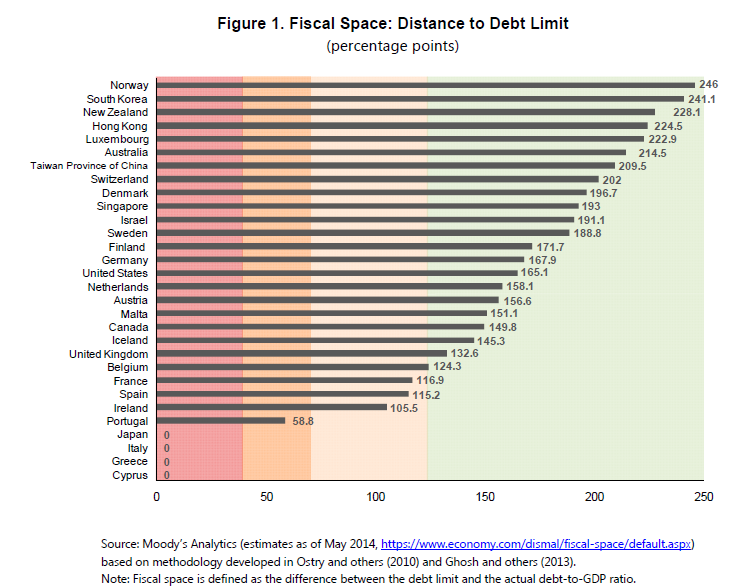
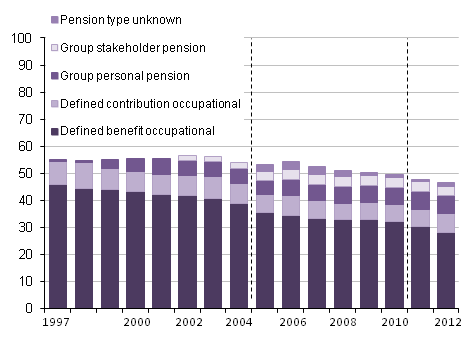
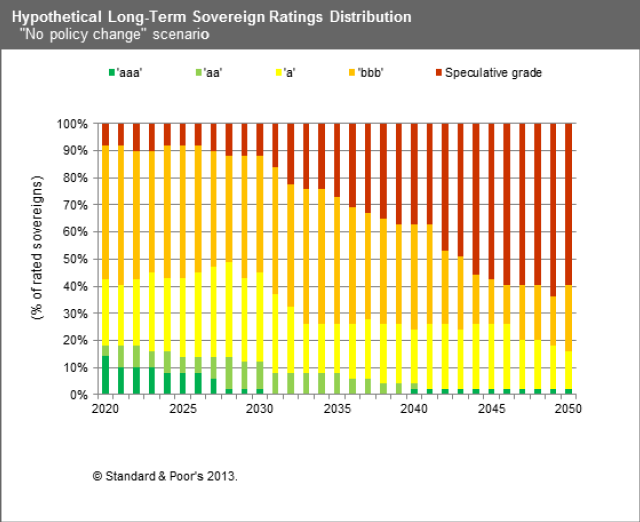
I have changed my mind. The first point has already been addressed in order to assess people against the annual allowance, although this may need to be further refined. The second point is more interesting. As Paul Mason has pointed out in Postcapitalism, the OECD 2010 report on policy challenges, coupled with S&P’s report from the same year on the global economic impacts of ageing populations point to the scenario pensions actuaries tend to refer to when challenged on the safety of Government bonds, ie if they fail then the least of your problems will be your pension scheme. The projections from S&P (see bar chart above) are that 60% of government bonds across all countries will have a credit rating below what is currently called investment grade – in other words they will be junk bonds. In this scenario private defined benefit schemes become meaningless and the returns from defined contribution schemes very uncertain indeed. A taxation system which seeks to extract tax on the way in rather than on the way out then looks increasingly sensible.
I think that both the popularity of ISAs and the consistently high take up of the tax free cash option by pensioners, however poor the conversion terms are in terms of pension given up, suggest that tax exemptions on the way out rather than on the way in would be massively popular.
3 Would an alternative system allow individuals to take greater personal responsibility for saving an adequate amount for retirement, particularly in the context of the shift to defined contribution pensions?
Based on my comments above, I think the whole idea of personal responsibility for saving adding up to more than a hill of beans for people currently in their 20s may be illusory. People do take responsibility for things they can have some control over. Pension savings in the late twenty-first century are unlikely to be in that category.
4 Would an alternative system allow individuals to plan better for how they use their savings in retirement?
As I have said I favour a TEE system like ISAs. I think some form of incentive will be required to replace tax exemption, such as “for every two pounds you put in a pension, the Government will put in one” with tight upper limits. The previous pensions minister Steve Webb appears to broadly support this idea. Exemption from tax on the way out (including abolition of the tax charges for exceeding the Lifetime Allowance) would also aid planning.
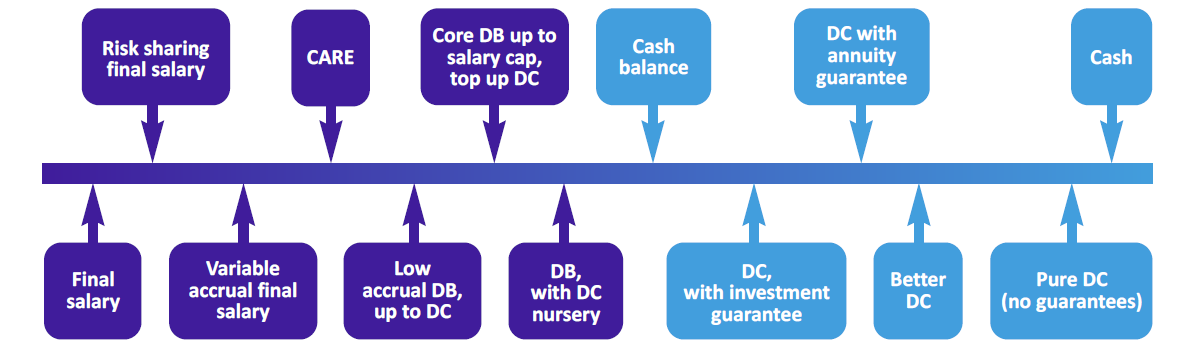
5 Should the government consider differential treatment for defined benefit and defined contribution pensions? If so, how should each be treated?
I think this is inevitable due to the fact that defined contribution (DC) schemes receive cash whereas defined benefit (DB) schemes accrue promises with often a fairly indirect link to the contributions paid in a given year. In my view taxation will need to be based on the current Annual Allowance methodology, perhaps refined as suggested by David Robbins and Dave Roberts at Towers Watson. The problem with just taxing contributions in DB is that you end up taxing deficit contributions which would effectively amount to retrospective taxation.
A further option discussed in Robbins and Roberts is making all contributions into DB schemes into employee contributions. I would go further and apply this to both DC and DB schemes – a sort of “reverse salary sacrifice” which could be encouraged by making the incentives on contributions only available on employee contributions, which would then be paid out of net pay. Any remaining accrual contributions made by employers in a DB scheme would be taxed by an adjustment to the following year’s tax code.
6 What administrative barriers exist to reforming the system of pensions tax, particularly in the context of automatic enrolment? How could these best be overcome?
I think everything points to the need for the retirement of DB for all but the very largest schemes. It would be better to do this gradually starting soon through an accelerated Pension Protection Fund (PPF) process rather than having it forced upon us in a hurry later in the century when PPF deficits may well be considerably higher than the current £292.1 billion.
7 How should employer pension contributions be treated under any reform of pensions tax relief?
As I have said, I think they should be converted into employee contributions based on higher employee salaries. This would make it clearer to people how much was being invested on their behalf into pension schemes.
8 How can the government make sure that any reform of pensions tax relief is sustainable for the future.
They can’t, and any change now will almost certainly be revisited several times over the next 50 years. However, systems where people feel they can see what is going on and which are tax free at the end are currently very popular and I would expect them to remain so for the foreseeable future. That takes care of political sustainability in the short term. What about longer-term economic sustainability? Faced by an uncertain and turbulent next 50 years where I have argued that personal responsibility (rather than communal responsibility) for pensions will seem increasingly irrelevant, I think what I have proposed will allow us to transition to a system which can be sustained to a greater degree.
We are entering what may prove to be a traumatic time for the world economy if Postcapitalism is even half right. Pensions taxation seems a good place to try and start to move our financial institutions in a more sustainable direction.
Nick Foster is a former pensions actuary who now lectures at the University of Leicester