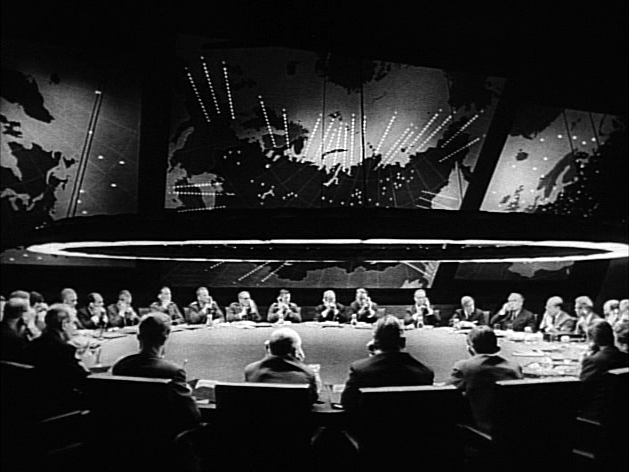
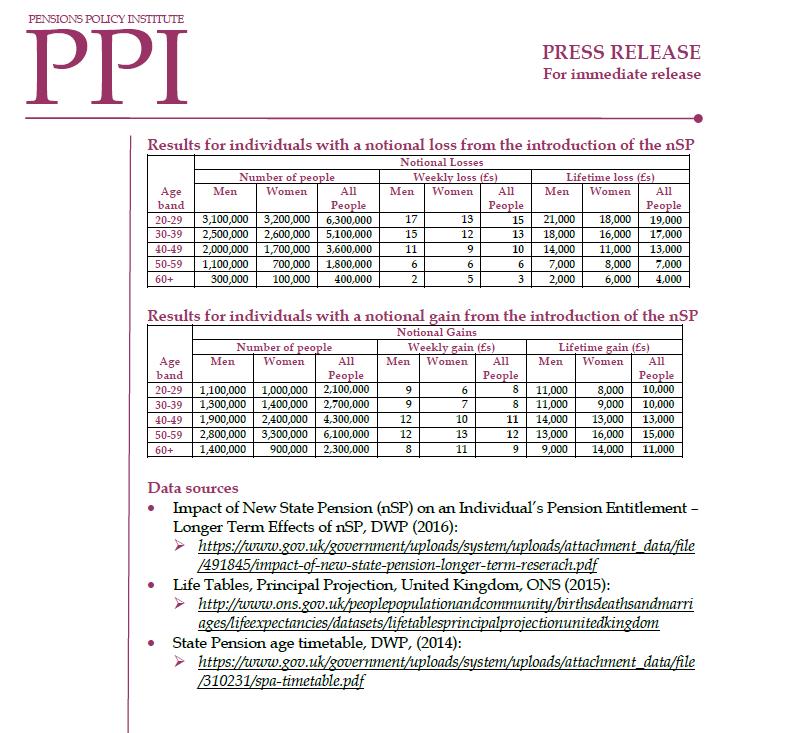
The War Room with the Big Board from Stanley Kubrick’s 1964 film, ”Dr. Strangelove”. Source: ”Dr. Strangelove” trailer from 40th Anniversary Special Edition DVD, 2004 Directed by Stanley Kubrick
In 1960, Herman Kahn, a military strategist at the RAND Corporation, an influential think tank which continues to this day, wrote a book called On Thermonuclear War. It focused on the strategy of nuclear war and its effect on the international balance of power. Kahn introduced the Doomsday Machine (which Kubrick used in his film “Dr Strangelove” alongside many other references from the book) as a rhetorical device to show the limits of John von Neumann’s strategy of mutual assured destruction or MAD. It was particularly noteworthy for its views on how a country could “win” a nuclear war.
For some reason Kahn came to mind as I was looking through Resource and Environment Issues: A Practical Guide for Pensions Actuaries, from the Institute and Faculty of Actuaries’ Relevance of Resource and Environment Issues to Pension Actuaries working party, which summarises the latest thinking on the climate change-related issues scheme actuaries should be taking into consideration in their work. I will come back to why.
The section which particularly caught my attention was called How might pensions actuaries reflect R&E issues in financial assumptions? This section introduces two studies in particular. First, we have the University of Cambridge Sustainability Leadership (CISL) report on Unhedgeable risk: How climate change sentiment impacts investment. This posits three “sentiment” scenarios (paraphrased slightly for brevity – see the report for details of the models used):
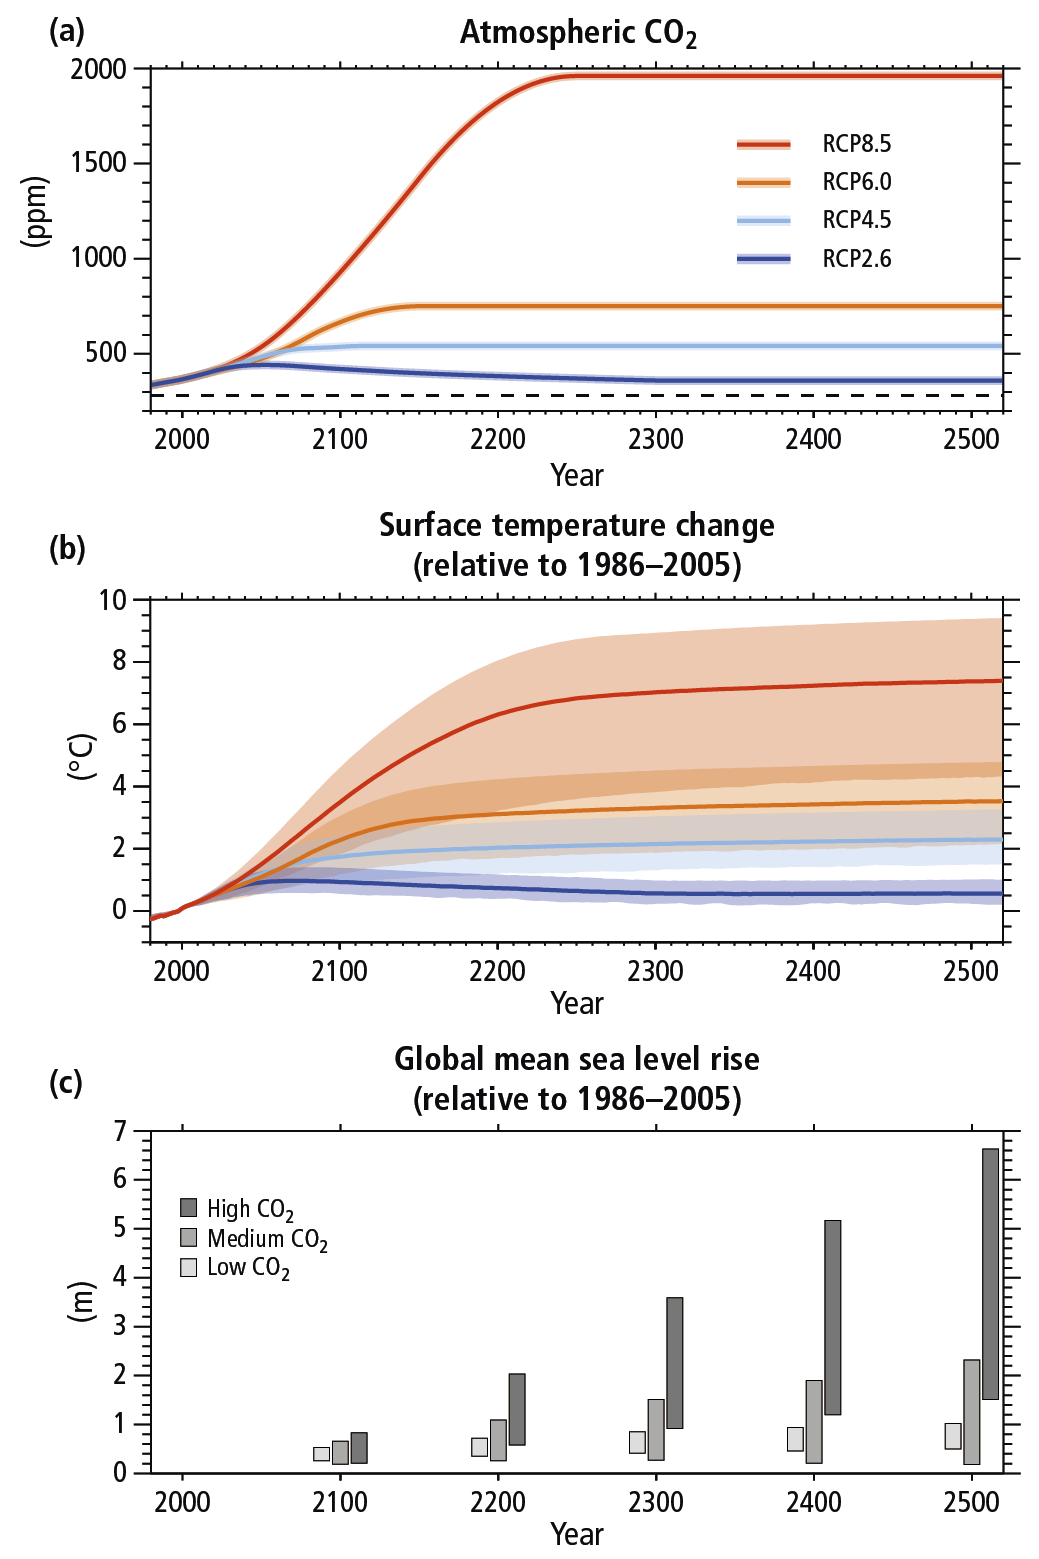
- Two degrees. This is defined as being similar to RCP2.6 and SSP1 from the Intergovernmental Panel on Climate Change (IPCC) AR5. Resource intensity and dependence on fossil fuels are markedly reduced. There is rapid technological development, reduction of inequality both globally and within countries, and a high level of awareness regarding environmental degradation. It is believed that under this scenario global warming will not raise the average temperature by more than 2°C above pre-industrial temperatures.
- Baseline. This is a world where past trends continue (i.e. the business-as-usual scenario), and there is no significant change in the willingness of governments to step up actions on climate change. However, the worst fears of climate change are also not expected to materialise and temperatures in 2100 are only expected to reach between 2°C and 2.5°C. This scenario is most similar to the IPCC’s RCP6.0 and SSP2. The economy slowly decreases its dependence on fossil fuel.
- No Mitigation. In this scenario, the world is oriented towards economic growth without any special consideration for environmental challenges. This is most similar to the IPCC’s RCP8.0 and SSP5. In the absence of climate policy, the preference for rapid conventional development leads to higher energy demand dominated by fossil fuels, resulting in high greenhouse gas emissions. Investments in alternative renewable energy technologies are low but economic development is relatively rapid.
The modelled long-term performance for a range of typical investment portfolios is worrying:
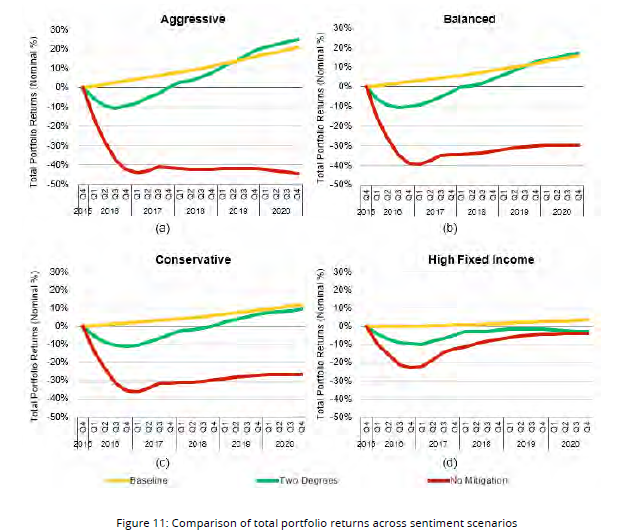
CISL suggest quite different investor behaviour depending upon which climate change path they think the world is taking: moving into High Fixed Income if No Mitigation seems to be the direction we are heading, but adopting an Aggressive (ie 60% equities, 5% commodities) asset allocation if the Two Degrees scenario looks most likely.
Elsewhere the report suggests hedging via cross-industry diversification and investment in sectors with low climate risk. For example under No Mitigation, it is possible to cut the maximal loss potential by up to 47% by shifting from Real Estate (in developed markets) and Energy/ Oil & Gas (in emerging markets) towards Transport (in developed markets) and Health Care/ Pharma (in emerging markets). However over 50% of losses in all scenarios remain unhedgeable (ie unavoidable through clever asset allocation alone).
The second report (Investing in a time of climate change) from Mercer in 2015, focuses on the following investor questions:
• How big a risk/return impact could climate change have on a portfolio, and when might that happen?
• What are the key downside risks and upside opportunities, and how do we manage these considerations to fit within the current investment process?
• What plan of action can ensure an investor is best positioned for resilience to climate change?
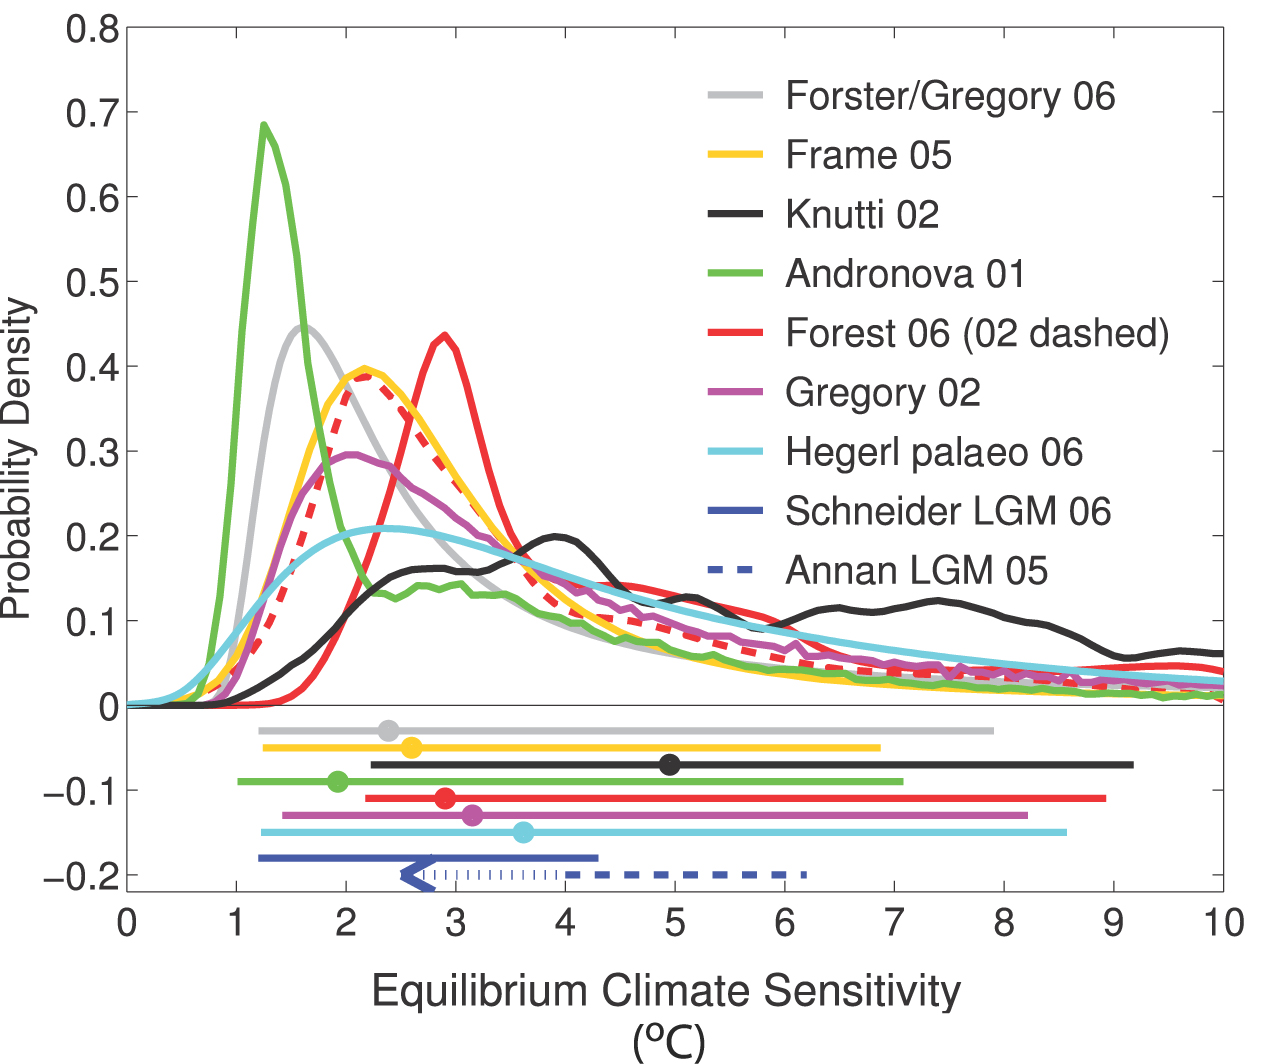
The section I was drawn to here (it’s a long report) was Appendix 1 on climate models used, and particularly those estimating the physical damages and mitigation costs associated with climate change. The three most prominent models used for this are the FUND, DICE and PAGE models, apparently, and Mercer have opted for FUND. They have then produced some charts showing the difference between the damages exepcted for different levels of warming predicted by the FUND model compared to DICE:
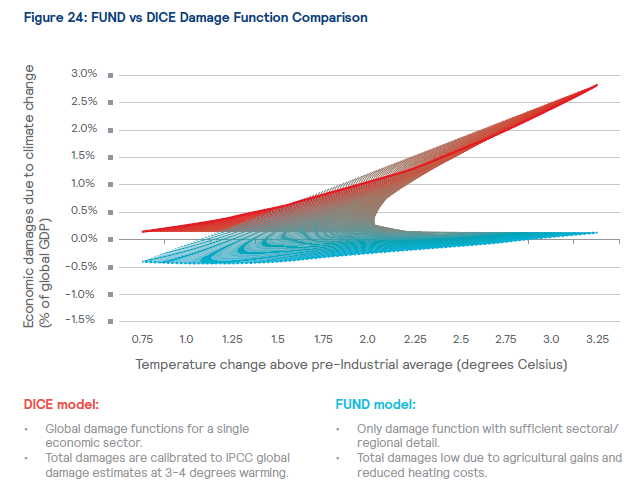
The result of this comparison, showing lower damage estimates by the FUND model, led the modellers to “scale up” certain aspects of the output of their model to achieve greater consistency.
Both of these reports have been produced using complex models and a huge amount of data, carefully calibrated against the IPCC reports where appropriate and with full disclosure about the limitations of their work, and I am sure they will be of great help to pension scheme actuaries (although there does some to be some debate about this). However I do wonder whether as a profession we should be spending less time trying to find technical solutions in response to worse and worse options, and more time trying to head off the realisation of those sub-optimal scenarios in the first place. I also wonder whether the implicit underlying assumption about functioning financial markets and pension scheme funding is a meaningful problem to be grappled with at 3-4° above pre-industrial averages as some of this analysis suggests.
In the summary of Mark Lynas’ excellent book Six Degrees: Our Future on A Hotter Planet, the three degree increase for which damages are being estimated is expected to lead to Africa […] split between the north which will see a recovery of rainfall and the south which becomes drier […] beyond human adaptation. Indian monsoon rains will fail. The Himalayan glaciers providing the waters of the Indus, Ganges and Brahmaputra, the Mekong, Yangtze and Yellow rivers [will decrease] by up to 90%. The Amazonian rain forest basin will dry out completely. In Brazil, Venezuela, Columbia, East Peru and Bolivia life will become increasingly difficult due to wild fires which will cause intense air pollution and searing heat. The smoke will blot out the sun. Drought will be permanent in the sub-tropics and Central America. Australia will become the world’s driest nation. In the US Gulf of Mexico high sea temperatures will drive 180+ mph winds. Houston will be vulnerable to flooding by 2045. Galveston will be inundated. Many plant species will become extinct as they will be unable to adapt to such a sudden change in climate.
The [IPCC] in its 2007 report concluded that all major planetary granaries will require adaptive measures at 2.5° temperature rise regardless of precipitation rates.[and] food prices [will] soar. Population transfers will be bigger than anything ever seen in the history of mankind. [The feedback effects from the] Amazon rain forests dry[ing] out and wild fires develop[ing] [will lead] to those fires [releasing] more CO2, global warming [intensifying] as a result, vegetation and soil begin[ning] to release CO2 rather than absorb[ing] it, all of which could push the 3° scenario to a 4°-5.5° [one].
The last time the world experienced a three degree temperature rise was during the geological Pliocene Age (3 million years ago). The historical period of the earth’s history was undoubtedly due to high CO2 levels (about 360 – 440ppm – almost exactly current levels). I would suggest that our biggest problem under these conditions is not that over 50% of losses on pension scheme investments remain unhedgeable.
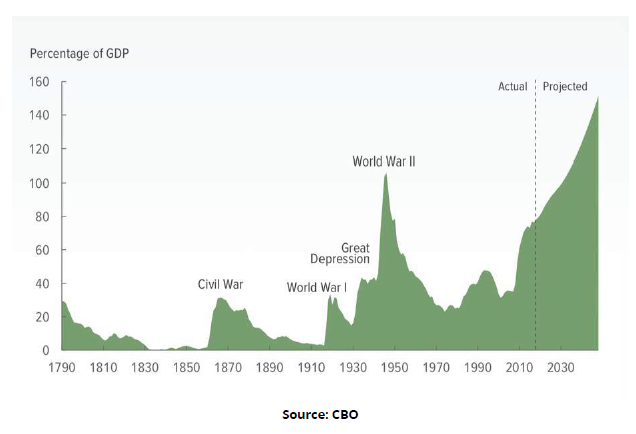
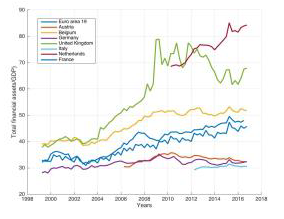
In his recent article for Social Europe, the unbearable unrealism of the present, Paul Mason presents two graphs. The first is the projection by the United States’ Congressional Budget Office of the ratio of debt to gross domestic product until 2048 in the United States.
The second is a chart from the IPCC showing how dramatically we need to cut CO2 emissions to avoid catastrophic and uncontrollable breakdown.
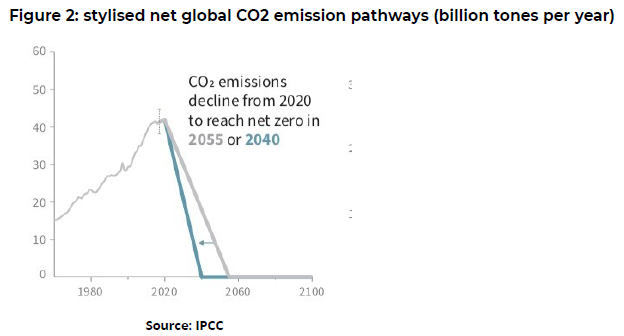
Mason feels that capitalism is too indebted to go on as normal and too structurally addicted to carbon. In his view Those who are owed the debt, and those who own rights to burn the carbon, are going to go bankrupt or the world’s climate will collapse. This feeling is echoed by George Monbiot here, where he cites a paper by Hickel and Kallis casting doubt on the assumption that absolute decoupling of GDP growth from resource use and carbon emissions is feasible and summarises some alternative approaches to the capitalism he feels no longer has the solutions.
Others dispute this, claiming that the Green New Deal is the only chance we have (here, here and here) to prevent irreversible climate change.
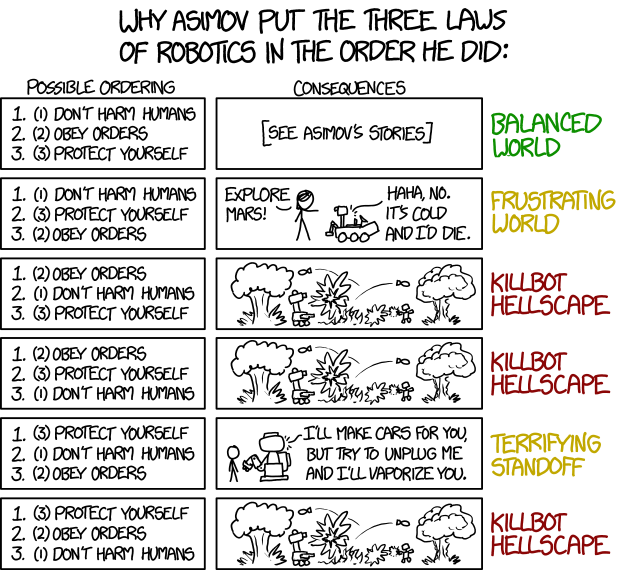
Whether you agree with any of these predictions or none of them, agree that we face a climate emergency or feel that is too extreme a description, it all brings me back to Kahn and Dr Strangelove. We seem to have replaced the MAD of the cold war with the MAD of climate change, except that this time we do not even have two sides who can prevent it happening by threatening to unleash it on each other. It is just us.
What we really cannot afford to be doing, via ever more complex modelling and longer and longer reports, is giving the impression that the finance industry can somehow “win” against climate change rather than joining the efforts to avert it as far as possible.

